From Friday, April 19th (11:00 PM CDT) through Saturday, April 20th (2:00 PM CDT), 2024, ni.com will undergo system upgrades that may result in temporary service interruption.
We appreciate your patience as we improve our online experience.
From Friday, April 19th (11:00 PM CDT) through Saturday, April 20th (2:00 PM CDT), 2024, ni.com will undergo system upgrades that may result in temporary service interruption.
We appreciate your patience as we improve our online experience.
02-13-2012 05:11 AM
Hi
I am my project on wavelet analysis of heart rate variability signal.
pls help me to find the power values from the wavelet coeffs n diff frequency bands
Solved! Go to Solution.
02-13-2012 07:55 AM
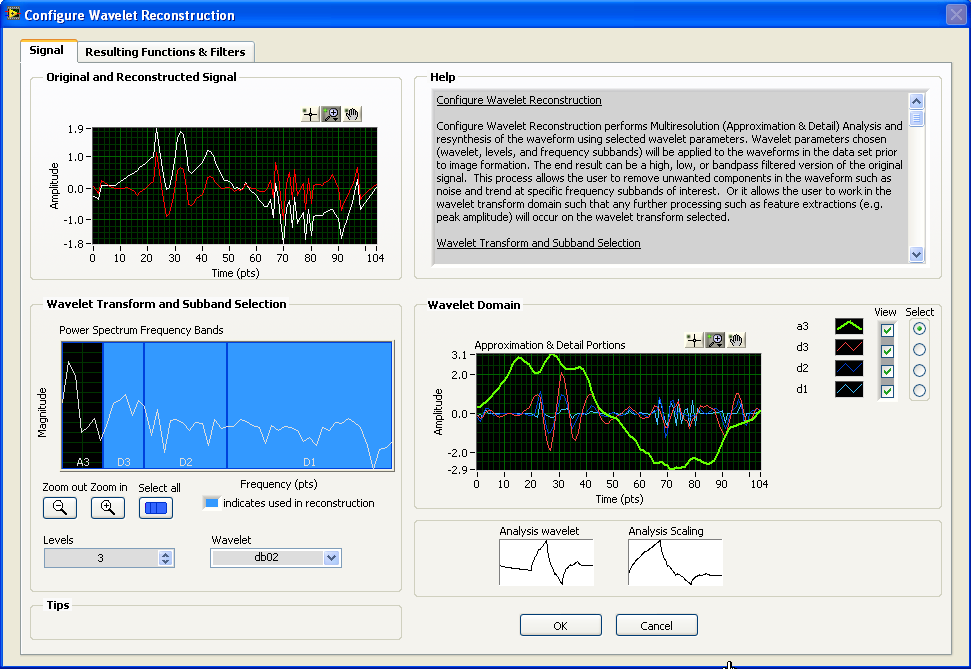
LabVIEW's advanced signal processing toolkit has an express VI that shows the frequency bands corresponding to the various wavelet coefficients on a power spectrum. I built something similar based on that express VI interface for my purposes (in the NDE Wave & Image Processor) with a few more options.
Here is the basic interface for something like this.
02-22-2012 09:27 PM
Hello
i'm trying to do some semg wavelet analysis too.
How can i extract the power spectrum graph (amplitude X frequency) from wavelet scalogram?
I've got 2 ways of implementation... CWT and AWT.... from the texts i've read, i'll be able to extract it using the cwt....
Could some one help?
Attached the VI and a 30 seconds contraction emg signal...
Ramon Campos
02-22-2012 09:37 PM
Hi,
Please check out the example under Your LabVIEW Folder \examples\Wavelet Analysis\WAGettingStarted.llb\Scalogram with Analytic Wavelet Transform.vi
Thanks!
ZJ Gu
02-23-2012 11:24 AM
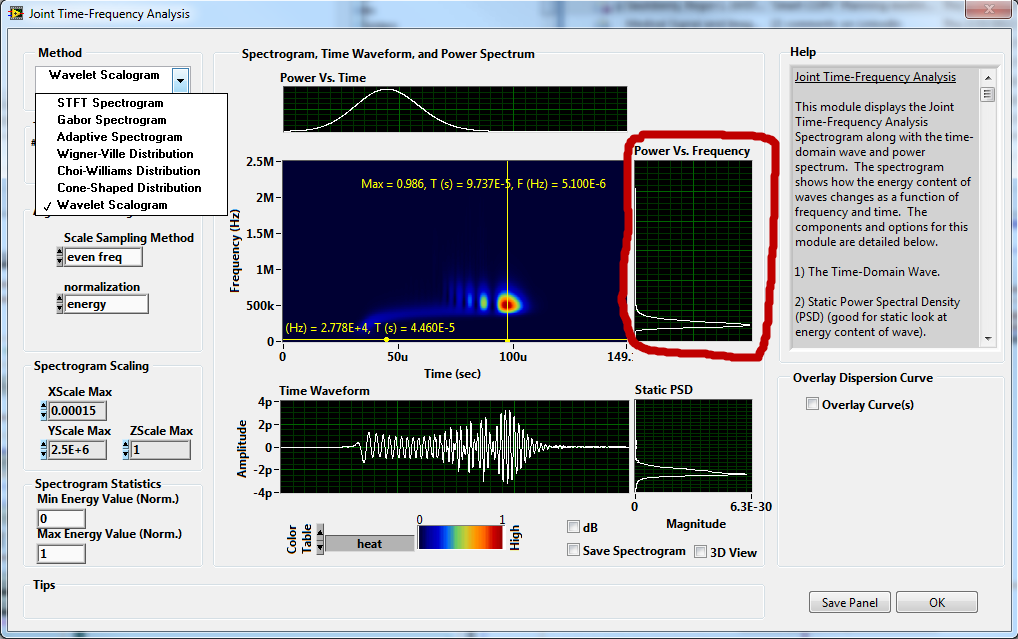
Using another LabVIEW Express/Example VI related to Joint-Time Frequency Analysis, I added the code for wavelet scalogram as an analysis option. Then I added the code for plots to extract power vs. time and power vs. frequency (shown sideways to correspond with frequency on y-axis of spectrogram), the latter of which is the power spectrum graph that you are searching for. The user can move the vertical cursor left and right to extract power spectrum at any time position (and also move the horizontal cursor up and down to extract power vs. time at any frequency position).
05-11-2017 10:47 AM
Hey Hello
Could you please tell me the name of that Express VI?
What i want to do is know the frecuency band of any coefficient that a best tree provides me, from an LabView example.
Thank you so much
🙂
