- Document History
- Subscribe to RSS Feed
- Mark as New
- Mark as Read
- Bookmark
- Subscribe
- Printer Friendly Page
- Report to a Moderator
- Subscribe to RSS Feed
- Mark as New
- Mark as Read
- Bookmark
- Subscribe
- Printer Friendly Page
- Report to a Moderator
ECG Feature Extractor
An electrocardiogram (ECG) is a graph, produced by electrocardiographs, that provides information about individual cardiac health. An ECG records bioelectric currents generated by the heart. Clinicians can evaluate the conditions of a patient's heart from the ECG and perform further diagnosis by extracting features, such as the heart rate, amplitude, and so on.
The ECG Feature Extractor is an application for extracting ECG features. This application includes the following features:
- Importing ECG signals from various data sources, such as the MIT-BIH Database, a binary measurement file (.tdms), a text-based measurement file (.lvm), and MATLAB® .MAT.
- Preprocessing and extracting ECG features, such as the QRS complex, P wave, T wave, ST segment, and so on.
- Exporting ECG features to a MIT-BIH Annotation file or to a binary measurement file (.tdms) for
Importing ECG Signals
Complete the following steps to import an ECG signals.
- Launch the ECG Feature Extractor.
- Click the Import ... button in the Operation section to display the Configure Biosignal Import configuration dialog box.
- Click the Browse button in the File path section and navigate to the file you want to import. The ECG Feature Extractor supports the following file types:
- .tdms
- .lvm
- MATLAB .MAT
- MIT-BIH Database
- Select a channel in the File contents section that contains ECG signals.
- On the Properties page, observe the properties of the channel you selected.
- On the Waveform Graph page, observe the ECG signal. You can use the scroll bar, zoom in, and zoom out buttons to observe the signal.
- (Optional) For MIT-BIT database files, place a checkmark in the show ann? checkbox to observe the annotation saved in the annotation file.
- Click the OK button to import the ECG signal and close the Configure Biosignal Import configuration dialog box.
- In the ECG Feature Extractor dialog box, observe the signal by using the scroll bar, zoom in, and zoom out buttons.
- Right-click anywhere in the Waveform display and select from the following options to set the range of the ECG signal to extract features.
- set start—Sets the start time of the signal.
- set end—Sets the end time of the signal.
- select all—Selects the entire time of the signal.

Preprocessing and Extracting ECG Signal Features
Complete the following steps to preprocess and extract the QRS complex from an ECG signal.
- Click the Set Extractor... button to display the Feature Extractor Settings configuration dialog box.
- On the QRS Complex page, select the Method to use to detect the QRS Complex. You can choose the following option:

- Multiscale Wavelet Peak Detection
Note The QRS Complex extraction algorithm in the ECG Feature Extractor is based on the Multiscale Wavelet Transform Peak Detection and auto threshold process. The initialization process uses the first eight seconds of ECG signals. Therefore, this application does not extract the QRS Complex from the first eight seconds of the signals.
- Multiscale Wavelet Peak Detection
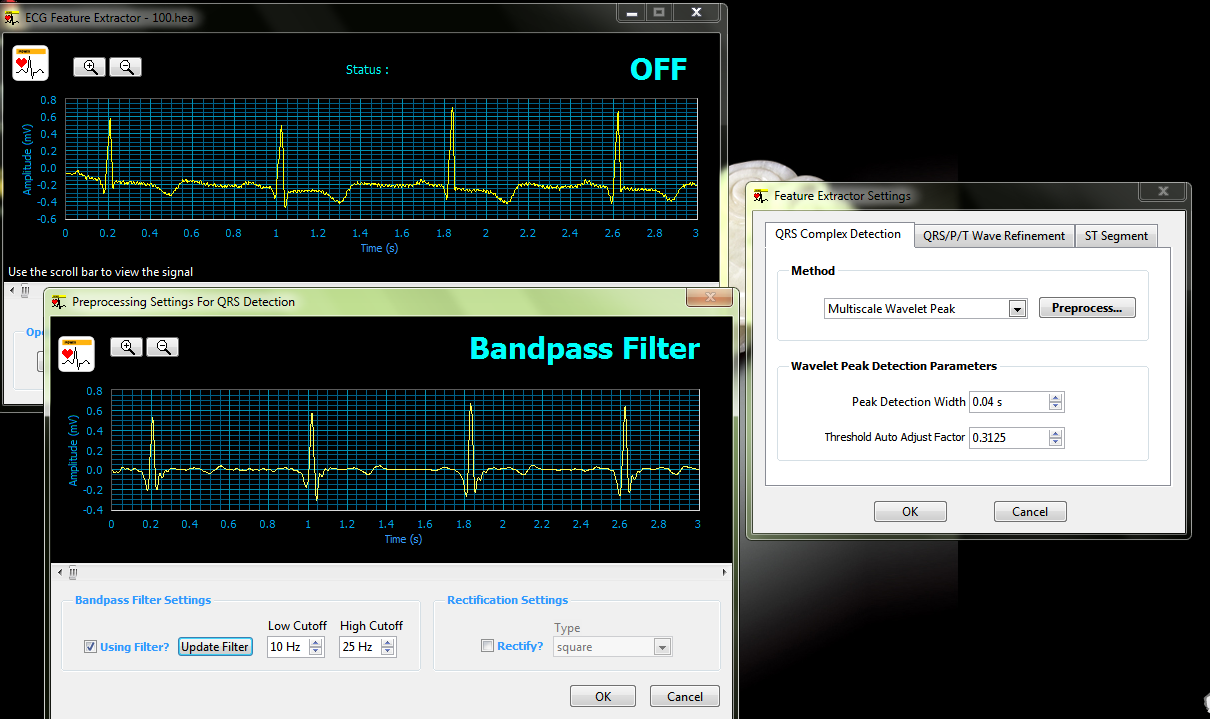
- Click the Preprocess... button in the Method section to preprocess the ECG signal. You can perform the following preprocessing functions:
- Bandpass filter
- Rectification
- Complete the following steps to preprocess the ECG signal you imported.
- Place a checkmark in the Using Filter? checkbox in the Bandpass Filter Settings section to include bandpass filter in the preprocessing phase.
- If the bandpass filter is not suitable, specify the Low Cutoff and High Cutoff of the bandpass filter.
- Click the Update Filter button to redesign the bandpass filter by using the low cutoff and high cutoff values you specified in the previous step.
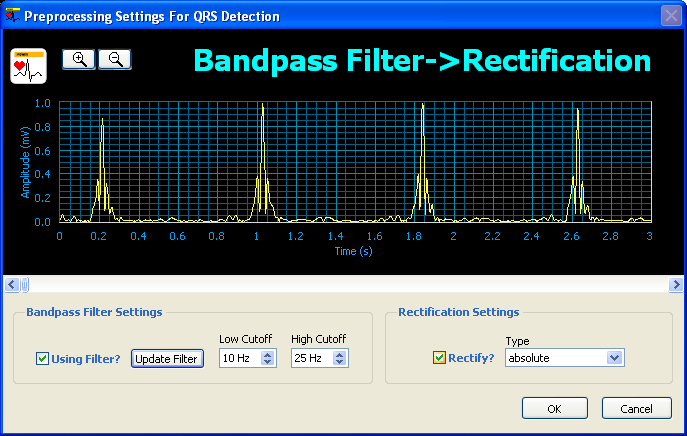
- Place a checkmark in the Rectify? checkbox in the Rectification Settings section to include rectification in the preprocessing phase.
- If the rectification is not suitable, you can specify the rectification type in the Type control.
- Observe the preprocessed ECG signal by using the scroll bar, zoom in, and zoom out buttons.
- Click the OK button to apply the preprocessing settings and to close the Preprocessing Settings For QRS Detection configuration dialog box.
- Set the Wavelet Peak Detection Parameters in the Feature Extractor Settings configuration dialog box. You can set the following controls:
- Peak Detection Width—Specifies the minimum width of QRS Complex which is used in detecting R wave peaks.
- Threshold Auto Adjust Factor—Specifies the auto adjust factor in the auto threshold process when detecting R wave peaks. The larger the factor is, the fewer the R wave peaks will be find.
- Click the OK button to apply the QRS complex settings and to close the Feature Extractor Settings configuration dialog box.
- Click the Run button to begin extracting features of the signal.
- (Optional) If the signal you are extracting features from is long, the feature extraction process will be time consuming. You can click the Stop button to end the feature extraction process.
- Observe the signal with the detected QRS Complex in the Waveform display.
- Click the Statistics button to display the Heart Rate Statistics dialog box. The Heart Rate Statistics dialog box displays information about features extracted from the ECG signal, such as the heart rate histogram.
- Right-click a heart beat in the Waveform display and select show Beat Characteristics to display the Beat Characteristics dialog box. The Beat Characteristics dialog box displays information about the heart beat at the instance you right-clicked. Observe information about the heart beat, such as the RR interval, QRS amplitude, and so on.


Use the Heart Rate Variability (HRV) Analyzer to analyze heart rate variability.
- Mark as Read
- Mark as New
- Bookmark
- Permalink
- Report to a Moderator
Maybe i´m asking one stupid question. Can we download this application or we have to pay for it? I have all requiremets but i´m new at this kind of cooperation.
- Mark as Read
- Mark as New
- Bookmark
- Permalink
- Report to a Moderator
Hi,
You could download the startup kit free!
Thanks!
- Mark as Read
- Mark as New
- Bookmark
- Permalink
- Report to a Moderator
Hi, Zhijun
when I try to use Feature Extractor Settings -> Click the Preprocess... button -> after I change and checkmark using filter, all change to
about Wavelet Peak Detection Parameters & Filter,
after I Click the OK button to apply the QRS complex settings and to close the Feature Extractor Settings configuration dialog box.
I found that the figure in interface is still the one before filter, what this problem mean, can I run a figure which process after filtering?
- Mark as Read
- Mark as New
- Bookmark
- Permalink
- Report to a Moderator
Hi Shuo,
After you configure the filter settings, right click on the graph and choose show preprocessed .
Thanks!
- Mark as Read
- Mark as New
- Bookmark
- Permalink
- Report to a Moderator
thanks Zhijun~
- Mark as Read
- Mark as New
- Bookmark
- Permalink
- Report to a Moderator
How to attach my .lvm and tdms files? There are no icons to attach files???! 
- Mark as Read
- Mark as New
- Bookmark
- Permalink
- Report to a Moderator
Hello!!
How can i use this kit to distinguish between a normal and an abnormal ECG signal.I am using the MIT-BIH database.
