- Document History
- Subscribe to RSS Feed
- Mark as New
- Mark as Read
- Bookmark
- Subscribe
- Printer Friendly Page
- Report to a Moderator
- Subscribe to RSS Feed
- Mark as New
- Mark as Read
- Bookmark
- Subscribe
- Printer Friendly Page
- Report to a Moderator
Precision Programmable Power Supply
Overview
A high performance programmable DC power supply module capable of handling up to 350 watt of power with an output voltage ranging from approximately 0 up to 50 volt and current sourcing up to 7 amp. With a 16-bit resolution for programming both voltage and current, it can achieve exceptionally high accuracy.
Technical Highlights
A custom Breakout Board and Development System was designed and built for the NI Single-Board RIO 96XX platform to provide an easy access to all signals from the PPPS circuitry and sbRIO system. Figure 1 shows the simplified block diagram of a single module PPPS system. The major components for the system are:
- NI sbRIO-9626, Embedded Device with Analog I/O and DIO, RMC Connector
- sbRIO-96XX Development System
- RKW-48-7K, 350W industrial grade single output power supply
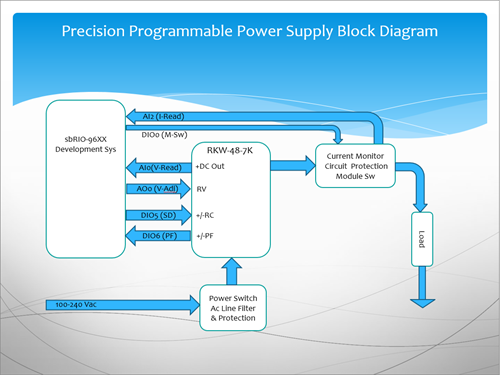 Figure 1: Block Diagram of a Single Module PPPS
Project Hardware and Software Setup
An interactive front panel communication between the FPGA target (sbRIO-9626) and the host computer is used to control and test the hardware and VIs running on the target. An implemented PID algorithm assures precise regulation of both voltage and current in mV/uA steps. Protection features include over voltage and current limiting, overtemperature, fan failure and power failure. Figures 2&3 represent FPGA front Panel/Block Diagram of the target VI.
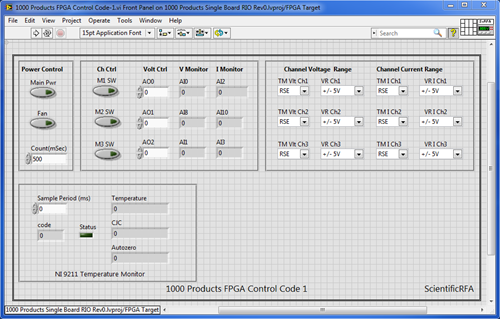 Figure 2: FPGA Front Panel Target VI
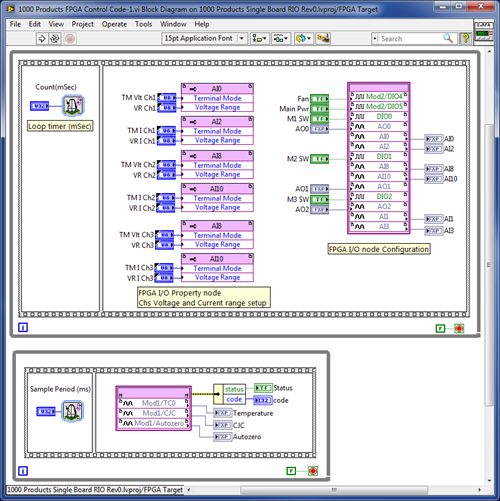
Figure 3: FPGA Target Block Diagram
Software
NI LabVIEW 2013 with FPGA and PID modules are used for the development of this product. The front panel consist of a tab control navigation for operating the power supply as well as setting up the PID's gains, output range, initialization etc. The front panel features "Mode Select" for selecting Constant Voltage (CV) or Constant Current (CC). The desired voltage or current can be adjusted via the appropriate knob or can be directly typed into the digital selector boxes for the exact value. The system also provides optional data saving in Excel format as well as an emergency shutdown button designated as "Main Power". Figure 4 shows the front panel of the PPPS and Figure 5 is the Setup panel for the PID configurations. Figure 6 & 7 are snapshots of PID section of the PPPS VI's block diagram respectively.
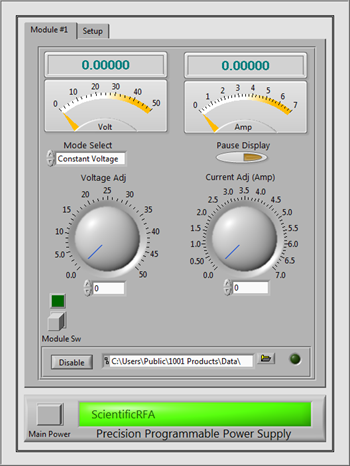
Figure 4, Front panel of the PPPS System
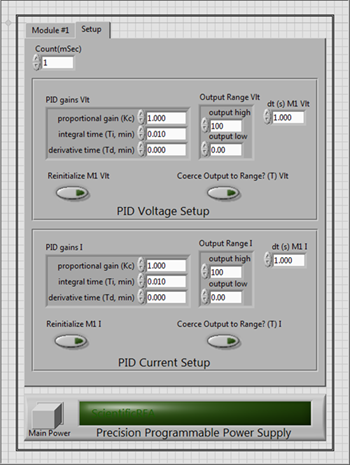
Figure 5, PIDs Setup Panel
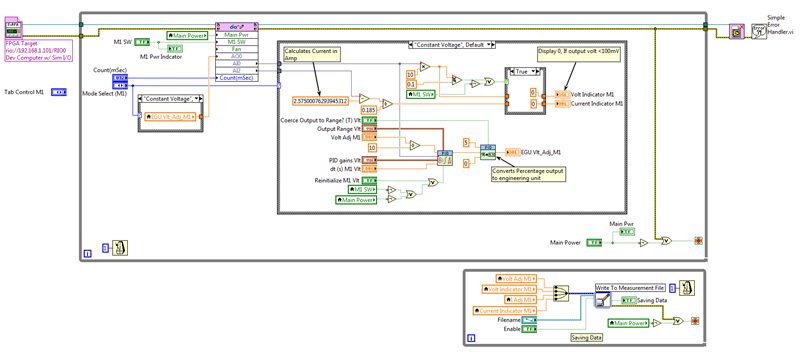
Figure 6, PID Constant Voltage (CV) Block Diagram
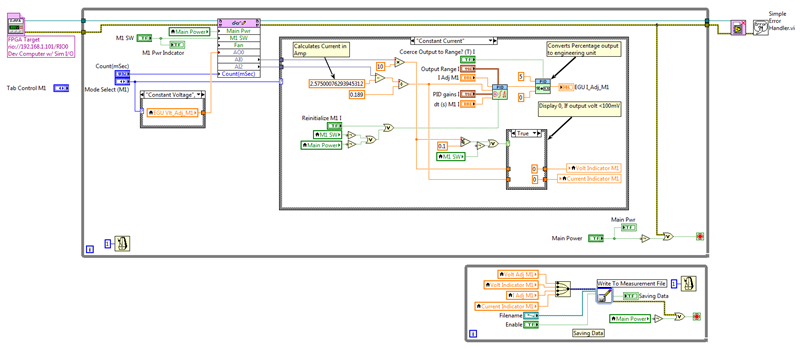
Figure 7, PID Constant Current (CC) Block Diagram
Other Possible Configuration and Applications for PPPS
Modular design allows for a quick system configuration such as “Triple Output DC power supply” as depicted in Figure 8 which is configured as a Dual Tracking power supply using first two modules and a constant voltage supply of 5, 3.3 and 2.2 volt for logic circuits (or any desire voltage/current). Similarly, these modules can be connected in series for higher voltage (up to 150V) or in parallel for higher current (up to 21A). Applications include, high performance programmable DC power supply ideal for R&D design and verifications, production testing and QA or battery and capacitor charging/testing in a constant voltage or current mode (or both).
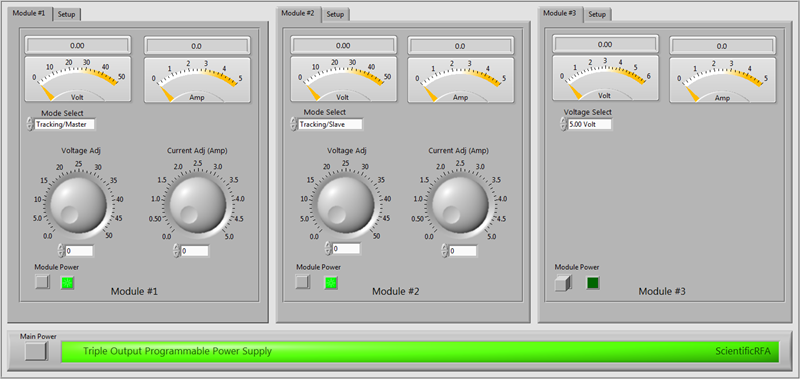
Figure 8, Modular Triple Output Power Supply
System Setup and Test
After compilation of the FPGA code, the PID gains and controllers were set to appropriate values for both CV and CC operations. (See PID Theory Explained at following link http://zone.ni.com/devzone/cda/tut/p/id/3782) . A dynamic load of 2 to 25 ohm / 150W was connected to the output terminals of the PPPS with Constant Current (CC) mode selected and set at 1amp. By varying the load from minimum to maximum (2 to 25 Ohm), data was logged and charted at approximately 1-second interval (Figure 9).
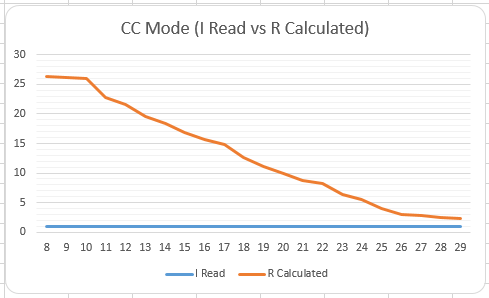
Figure 9, Constant Current Mode vs Dynamic Load
Related Links
- sbRIO-96XX series DIO/MIO Breakout and Development Board
- Slide show demonstrating this development system
