From 04:00 PM CDT – 08:00 PM CDT (09:00 PM UTC – 01:00 AM UTC) Tuesday, April 16, ni.com will undergo system upgrades that may result in temporary service interruption.
We appreciate your patience as we improve our online experience.
From 04:00 PM CDT – 08:00 PM CDT (09:00 PM UTC – 01:00 AM UTC) Tuesday, April 16, ni.com will undergo system upgrades that may result in temporary service interruption.
We appreciate your patience as we improve our online experience.
Purpose:
The purpose of this assignment is to assist you in learning how to acquire analog data, as well as how to display and save long term data using LabVIEW.
Procedure:
Construct the hardware circuit, and for each section in the software section, complete the indicated task. Make sure to print the indicated material and data for inclusion in your report.
The report format for this assignment will be the engineering memo format. There is no requirement for you to demonstrate your programs, and you may work with a partner if you so choose, however be sure that you fully understand how to do these programming functions as you will be using these techniques later in the course. You may turn in a joint report if you work with a partner.
Be sure to include the grade sheet as the final page, behind all your attachments.
Hardware Setup:
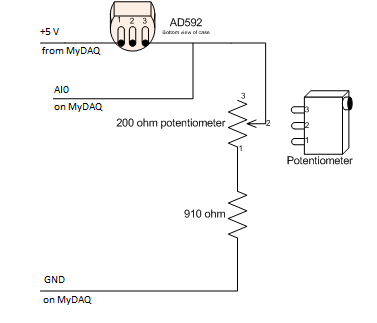
Create the circuit shown in the following diagram using your MyDAQ, solder-less breadboard, one AD592, one 910 ohm resistor and one 200 ohm potentiometer. This will connect the AD592 as a single ended input to your data acquisition card. Use the components from your kit, and the wires from the network cable as hookup wire for your connections.
Software:
Part 1:
Create a NI-DAQmx task using Measurement and automation explorer named “ad590” that will acquire analog input voltage according to the following specifications:
Create a LabVIEW VI that reads a single value from this task, displays it to a numeric indicator and to a waveform chart. As indicated in lecture the ONLY DAQ block required will be DAQmx Read.vi since the task will be created external to the LabVIEW program.
Execute the program in continuous mode. Notice that the numbers and the chart are slightly unstable, indicating that there is electrical noise on the extremely small signal. Using the chart, try to adjust the mean voltage by using the potentiometer so that value is according to the following formula:
0.272 Volts + (.001Volt * Current room temp in deg C)
The hardware should now be calibrated for the current room temperature.
Stop the program and print the front panel showing your plot of data for inclusion in your report, along with the VI Documentation Block Diagram and List of subVIs and Express VIs of the program. Discuss any issues you had with this in the memo.
Part 2:
Modify the task you created to the following:
Modify your program to read the new data as an array, and to display the arithmetic mean value of the array in both the numeric window and the same chart you used in the previous step. Note that the chart will still show a considerable amount of fluctuation, however also notice that this looks much larger than it really is because of the autoscale of the Y axis.
Part 3:
Modify your program from part 2 to subtract 0.272 volts from the mean value and then multiply this new value by 1000 to create a temperature output in degrees C. Modify the chart Y axis so it shows from 20 to 40 (rather than autoscale) and execute the program in continuous mode. Touch your finger to the sensor to increase the temperature the device is seeing and stop the program with the transition on the display. Print this display to hand in with your report along with the VI Documentation Block Diagram and List of subVIs and Express VIs of the program.
Run the program and determine what the approximate amount of noise is in degrees and discuss this in the memo.
Part 4:
The ability to store data for later use is an important part of data acquisition. In the following section you will be using the circuit you just developed as a source for data, and you will be asked to create programs that will save data in two different forms. The first, high speed data, is generally acquired and then saved in a file for later use. LabVIEW can do this as a waveform file, however, doing so makes it very difficult for the data to be imported into other programs, such as excel. To make spreadsheet files requires a bit more effort, and the addition of a timing track on your data. The first program you will develop will read data from the temperature sensor and then modify the array to add timing before saving in a file.
The second type of storage is for long term data. If you are taking data that will be collected over a long period, such as a day or longer, any crash of the computer will cause your data to be lost. Saving the data to a file immediately saves the data from being lost, and all you would have is a slight time gap while the computer is brought back up and the process started again. This is done by continuously appending data to a text file. The second program will help you work though this process.
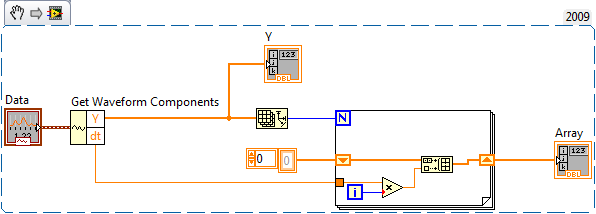
Create a new program to read the data from the task as modified for Part 2. Set the polymorphic DAQmx Read VI to output the data in a waveform rather than an array. Use the Get Waveform Components to split the data into an array(Y) and a dt value.
The following snippet shows one way this can be done. The for loop creates an array of time values based on dt. The list of time values must start at 0 and have the same number of elements as the data array (y).
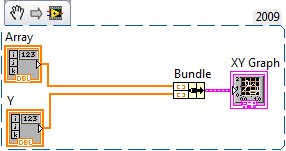
You are going to display the data on an XY graph for this section, so remove the waveform chart and add an XY Graph to your front panel. To send the data you will need a Bundle object to combine the two arrays for the XY graph object. The first array in the bundle (top) is x (time) and the second array is the y values. The following snippet illustrates this.
Execute this portion of the program and debug it until you are satisfied it is working.
Once you have completed the above portion, add the following objects to save the data to a file.
These two blocks combined will combine the two 1D arrays (time and degrees) into a single 2D array that will then save as a spreadsheet file that can be opened with excel.
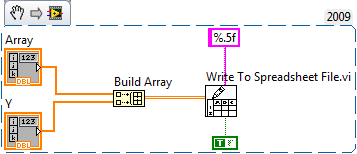
Note that you will have to set the Write to Spreadsheet File object to transpose the data from row to column format, and you will have to specify the format of the data to be at least a 5 digit floating point value (%.5f).
Once you have this program done, execute it and print the front panel and the first page of the data file for your report. Also print VI Documentation Block Diagram and List of subVIs and Express VIs of the program for attachment.
Notice that the data is only shown as volts, not as temperature. In a later assignment we will show you methods to convert the data to actual engineering units.
Part 5:
The previous section showed how to handle high speed data, but not low speed data.
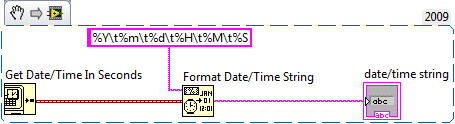
Starting with a copy of the program you developed for part 3, modify the program to get the current system date and time, and to append the time and the mean temperature into a tab delimited text file. The following snippet shows how to get the system time and convert it to a text string to put into the file. You can use the format %Y\t%m\t%d\t%H\t%M\t%S to create a tab delimited date time string. You will need to concatenate this with a string representation of your mean value, and appropriate tab and end of line characters.
Use the following blocks in your completed program (you may use more than this)
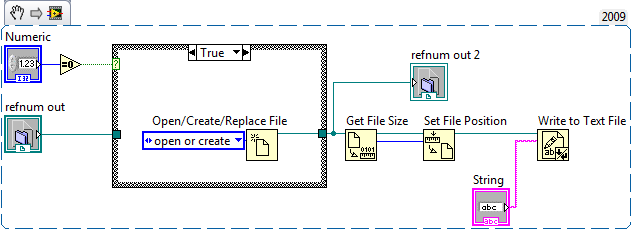
The following code snippet is one of just many ways to append to a text file. Since you would like to select the file only once each time the program is run, the entire program is placed in a while loop. Detecting the sequence iteration =0 allows the open file selection to happen only on the first iteration of the loop. The numeric in the following snippet could be wired instead to the iteration counter to detect the first loop. By wiring the refnum to a shift register instead of the refnum in and out blocks, the loop will continually pass the data for each iteration of the loop, reusing the name specified in the first iteration. The string value would be the entire string line that is to be inserted into the end of the file. If you wish this to actually be a line (and you do) you must be sure to have a line feed / carriage return as the last character of the string.
This method saves text data to a file, which requires that he mean of the reading be converted to a string, and that the system time be converted to a string.
Once you have this program running add one final component, Wait (ms). This object will allow you to s control how quickly it takes data by waiting x number of milliseconds between each loop.
Now run this program to track the temperature in your work area for at least ten hours, recording a data value to the file every thirty seconds.
LabVIEW Resources:
For help with programming in LabVIEW please review the appropriate videos in our Learn to LabVIEW with MyDAQ Course.
Report and Submission:
In your report discuss how you structured this program, what difficulties you had, if any, and include the a printout of one page of your data file as well as a graph of the whole data file. Also include VI Documentation Block Diagram and List of subVIs and Express VIs of the program as an attachment.
In your report, discuss the overall project, what was easy, what was difficult for you. What issues did you come across that you found of importance. Describe at least one use for this type of temperature device that you can think of (remember to look at the temperature limits in the data sheet!)
