Turn on suggestions
Auto-suggest helps you quickly narrow down your search results by suggesting possible matches as you type.
Showing results for
Document Options
- Document History
- Subscribe to RSS Feed
- Mark as New
- Mark as Read
- Bookmark
- Subscribe
- Printer Friendly Page
- Report to a Moderator
Document options
- Subscribe to RSS Feed
- Mark as New
- Mark as Read
- Bookmark
- Subscribe
- Printer Friendly Page
- Report to a Moderator
Overview
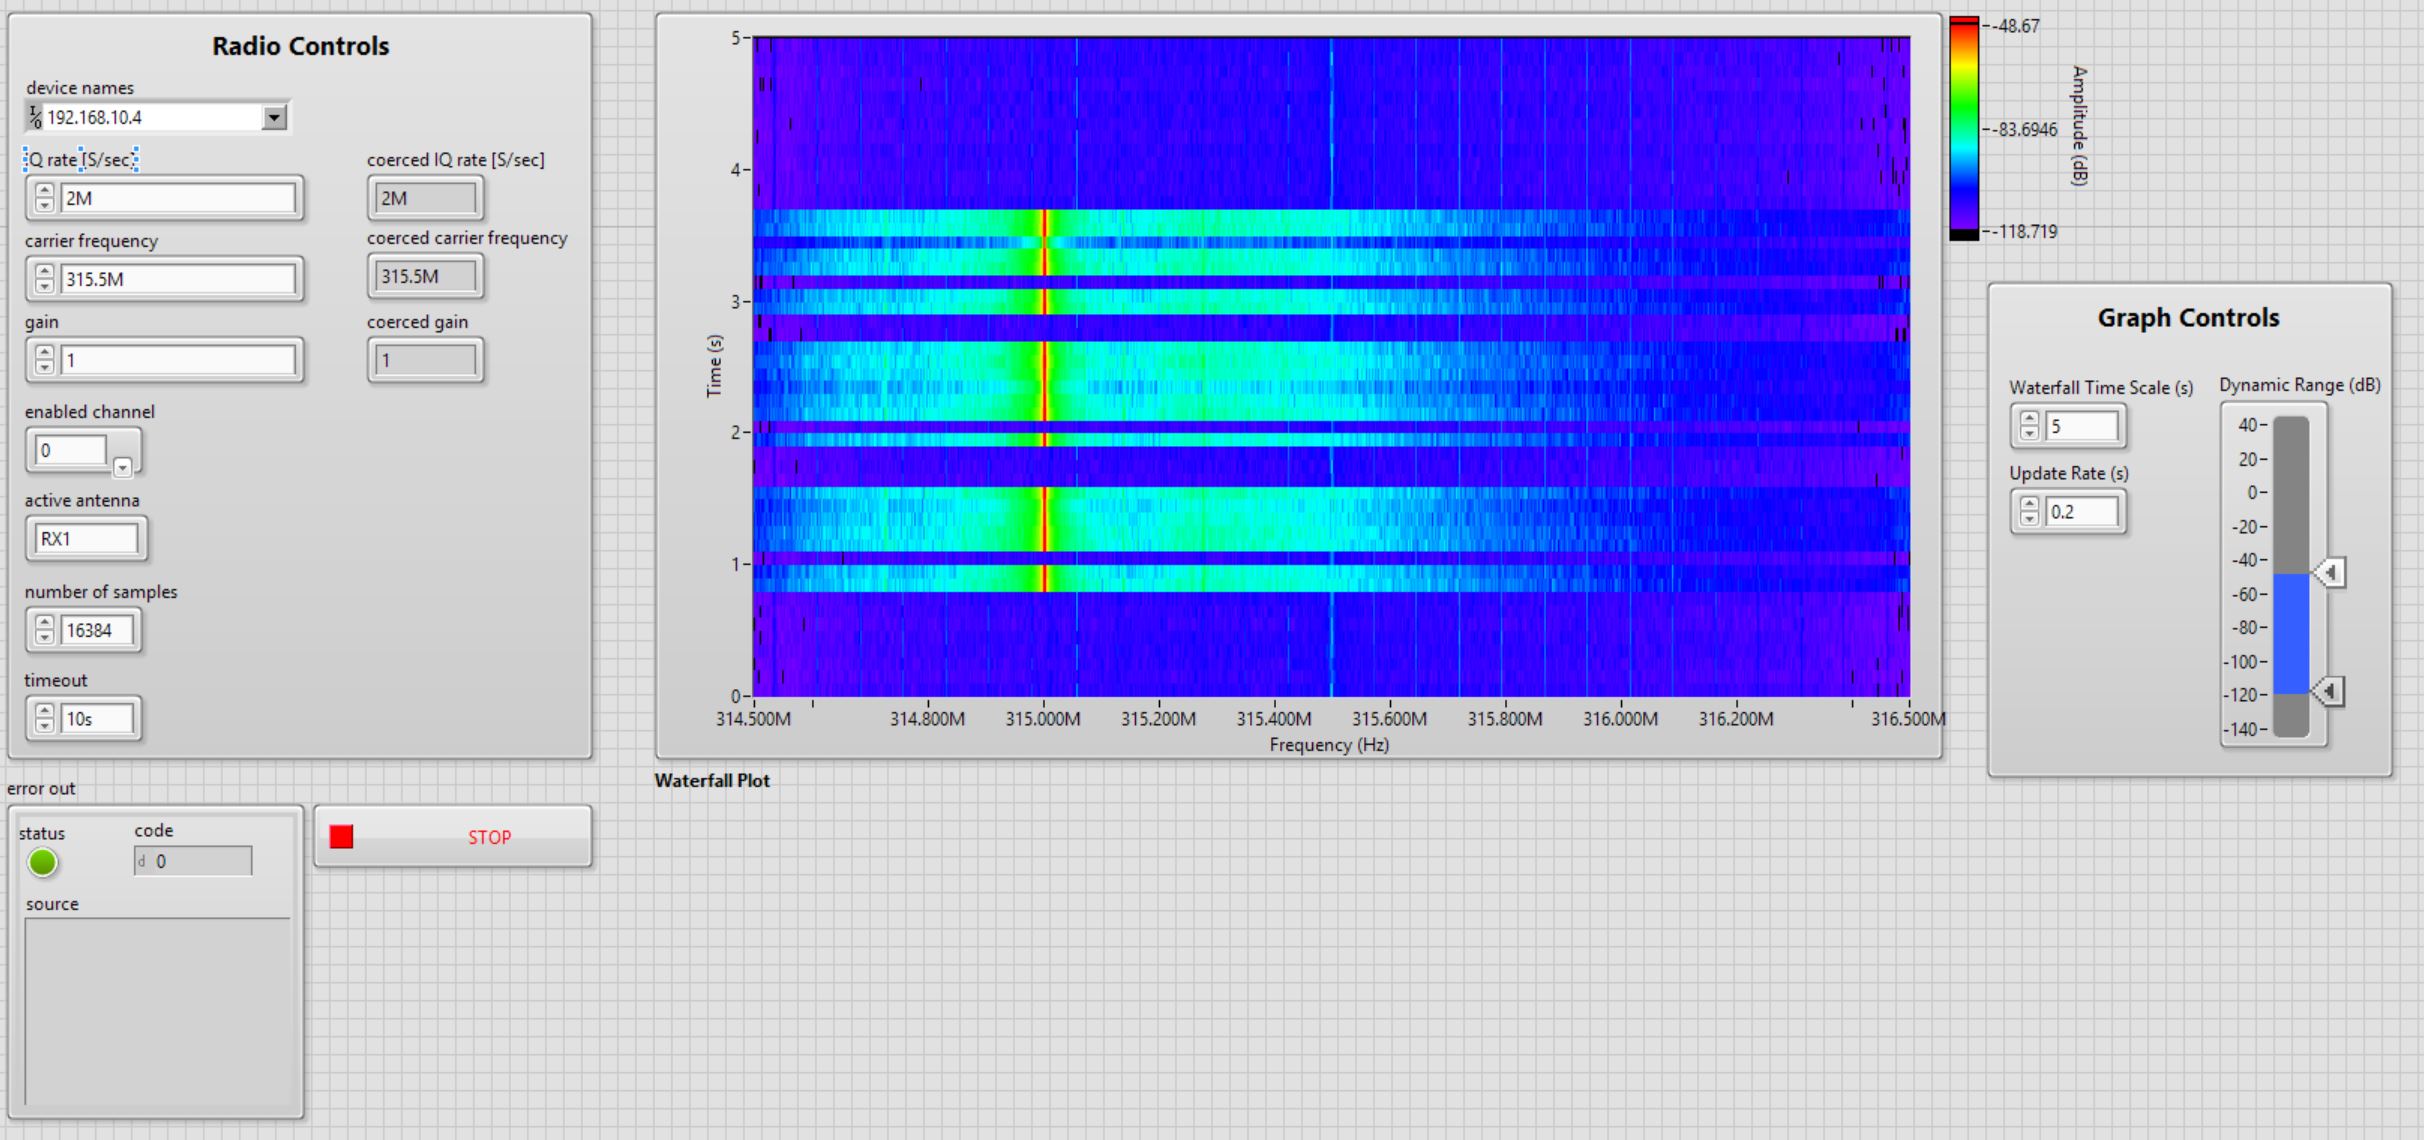
This example uses the USRP as a spectrum analyzer by adding a spectrogram, also known as a "waterfall plot". This makes it much easier to spot periodic signals and signals that would otherwise be lost in noise.
Description
This example uses the Continous Rx Async example as a starting point. The example is built into both LabVIEW and LabVIEW Communications. It simply adds a waterfall plot to display the spectrum in a useful way. The plot is generated by using an intensity chart and compiling a set number of previous runs. The level of graph "history" can be modified using the "Waterfall Time Scale" control. You can adjust the intensity scale by using the Dynamic Range slider in LabVIEW, or by clicking on the Z scale and modifiying the max and min in LabVIEW Communications.
Steps to Implement or Execute Code:
Choose the correct device name/ ip address (check the getting started guide of your USRP if you are unsure what this is). Then, specifiy your carrier frequency and IQ rate (bandwidth).
Requirements
Software
- LabVIEW Communications System Design Software or Suite 2.0 or LabVIEW 2014 or later.
Hardware
- Any USRP compatible with LabVIEW
Labels:
Comments
Options
- Mark as Read
- Mark as New
- Bookmark
- Permalink
- Report to a Moderator
10-06-2016
02:29 AM
Hello,
could you please attach a version saved in LabVIEW 2014?
Many thanks and best regards,
Felice
Options
- Mark as Read
- Mark as New
- Bookmark
- Permalink
- Report to a Moderator
10-06-2016
08:57 AM
Sure thing. I updated the file. It should run in LabVIEW 2014 now.
