- New 126
- Under Consideration 9
- In Development 0
- In Beta 0
- Already Implemented 2
- Completed 0
- Duplicate 0
- Declined 2
- Subscribe to RSS Feed
- Mark as New
- Mark as Read
- Bookmark
- Subscribe
- Printer Friendly Page
- Report to a Moderator
Additional option for plotting variables on separate graphs on the same graph page.
When I perform any analysis, all the selected output variables are plotted on the same graph, this is good for most of the times, but sometimes I desire them to be plotted on separate graph (but on same graph page) for easy comparison and I know this can be done by copying the original graph and paste it on the same page and then deselect the unwanted variables, which is tedious work.
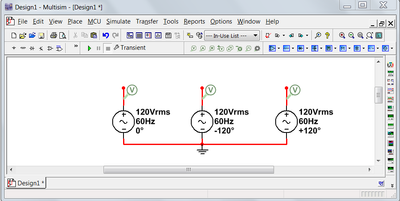
In the screen-shots,
Screenshot_2: Circuit diagram of 3-phase voltage.
Screenshot_3: What multisim does by default - Plotted all the variables on same graph (which is good most of the times!)
Screenshot_4: I manually separated the plots by copy-paste the graph on same graph page and deselect the unwanted variables, looks good! (but tedious)
Screenshot_5: Disadvantage is - If you zoom in to one graph, the same won't be affected on the other two, one way is to manually copy the graph properties and paste in onto other, but again you will also end up in having same variable selected (red one).
All together it will be a tedious task if one has to plot many such graph and use zoom feature regularly.
So I request the NI team to provide an additional option to plot the variables on separate graphs on the same graph page. User should be able to change the bottom axis range of all graph simultaneously for easy comparison and zoom feature must work for all the graphs simultaneously. Also provide same cursor for all the graph plots.
You must be a registered user to add a comment. If you've already registered, sign in. Otherwise, register and sign in.


