- Subscribe to RSS Feed
- Mark Topic as New
- Mark Topic as Read
- Float this Topic for Current User
- Bookmark
- Subscribe
- Mute
- Printer Friendly Page
removing plot legend from a graph?
Solved!03-14-2013 10:04 PM
- Mark as New
- Bookmark
- Subscribe
- Mute
- Subscribe to RSS Feed
- Permalink
- Report to a Moderator
Hi - another question from a beginner:
Following the tutorial, I created a graph. The graph has a small box to its right where a legend for the various plots go. (I'd post a pic, but it looks like I'm not yet permitted to do that.)
The purpose of the graph is to plot several thousand points on a cartesian plane. I got this working (sort of) with the function PlotPoint(). When I run the program, though, the sheer number of points quickly overwhelms the capacity of this legend (and stalled the program to boot).
So: can I get rid of this legend somehow? On a side note, am I being inefficient with this approach? Would it be better to gather the points in to an array and use PlotXY instead?
Thank you.
Solved! Go to Solution.
03-15-2013 01:21 AM - edited 03-15-2013 01:26 AM
- Mark as New
- Bookmark
- Subscribe
- Mute
- Subscribe to RSS Feed
- Permalink
- Report to a Moderator
Hi,
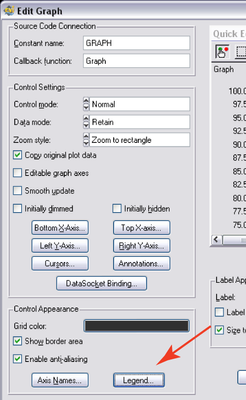
concerning the legend, open the respective popup panel by pressing the Legend button on the Edit Graph control panel:
On top of this panel you will see a check box Show Legend:
This check box should do the job...![]()
Concerning the choice of plotting functions: I wouldn't plot 1000 individual data points, but rather use PlotXY. Alternatively you can consider using a strip chart instead of a graph, which allows you to add one data point after the other
03-15-2013 09:27 AM
- Mark as New
- Bookmark
- Subscribe
- Mute
- Subscribe to RSS Feed
- Permalink
- Report to a Moderator
Oh man, how did I miss that one...thanks, Wolfgang.


