- Document History
- Subscribe to RSS Feed
- Mark as New
- Mark as Read
- Bookmark
- Subscribe
- Printer Friendly Page
- Report to a Moderator
- Subscribe to RSS Feed
- Mark as New
- Mark as Read
- Bookmark
- Subscribe
- Printer Friendly Page
- Report to a Moderator
LabWindows/CVI Tip: Understanding Break On Change Watch Expressions
Summary
When tracking down bugs, it sometimes is useful to implement conditional logic to change the execution of the code. This tip shows how "Break On Change" allows you to control the flow of your program conditionally when debugging.
Contents
- Using Watch Expressions with Break On Change
- Suspending Execution after a Watch Expression with Break On Change
Using Watch Expressions with Break On Change
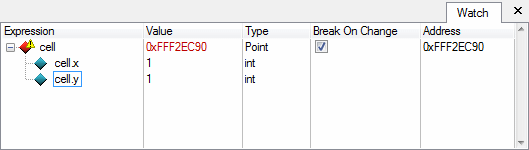
The Watch window enables you to define your own combination of variables and expressions to view, similar to the Variables and Call Stack window. It also helps you track down value changes of specific variables. You can drop a variable in the Watch window to add a watch expression or create one yourself, and check the corresponding checkmark in the Break On Change column. The value of the watch expression displays red text if the variable value changed from the last time the program was suspended (e.g. when stepping over instructions).
The icon of each watch expression indicates the different states that can take place while debugging an application:
| Icon | Description |
|---|---|
 | Ordinary watch expression without Break On Change enabled. |
 | Watch expression with Break On Change enabled. The value of the expression has not yet been changed. |
 | Watch expression with Break On Change enabled that is using CPU support, has been triggered. The expression has changed causing the program to suspend at the source code line where the Break On Change was triggered. |
 | Watch expression with Break On Change enabled that is not using CPU support, has been triggered. The expression has changed causing the program to suspend. However, the source location where execution has suspended is slightly offset because one of the following factors:
|
Suspending Execution after a Watch Expression with Break On Change
The reason why there are two types of Break On Change states when an expression is changed is due to the mechanism LabWindows/CVI uses internally to detect a memory change. The LabWindows/CVI debugger uses two types of watch expressions when Break On Change is enabled: the first one uses hardware support (also known as hardware watchpoints) and the second one doesn’t (also known as software watchpoints).
Hardware watchpoints leverage the support of the CPU and provide considerably faster execution speed than software watchpoints when debugging larger applications. Internally, hardware watchpoints have less overhead than software watchpoints, but are limited in some functionality. Therefore, in order to benefit from hardware supported Break On Change watch expressions, you are is restricted to the following conditions:
- You must define at most 4 watch expressions with Break On Change enabled during a debug session.
- The representation size of each watch expression with Break On Change enabled must fit into the size of a CPU register corresponding to the bitness of the debugged application. For example, when debugging a 32-bit LabWindows/CVI application, the size of an individual watch expression with Break On Change enabled must not exceed 4 bytes.
- Hardware watchpoints are supported only when debugging Windows applications.
Software defined watchpoints are used whenever the above restrictions are not met. In this case, execution speed will be considerably affected when debugging larger applications. Moreover, the debugger isn’t able to suspend the execution of the program at the exact instruction or source code position where the value corresponding to the watch expression has changed, so the Watch window will signal this through a yellow warning triangle on top of the red watch expression diamond.
Not only may the source position be slightly different with software watchpoints, but in the case of multithreaded applications, execution might suspend in a different thread. Be aware of this behaviour when using software watchpoints and identify the correct source location that caused the memory change using the Variables and Call Stack window and Threads window.
Did you find this tip useful? Rate this document or add a comment below.
If you give this a try, share your experience! Add a comment below.
- Mark as Read
- Mark as New
- Bookmark
- Permalink
- Report to a Moderator
Thank you for your messages!I need more examples because of my English ability is very weak.So,I hope you can help me!Thank you again!
- Mark as Read
- Mark as New
- Bookmark
- Permalink
- Report to a Moderator
rxl8212, thank you for your feedback!
Do you have any specific examples that you would like to have on this topic, or is it just in general that you think more examples would help?
Best regards!
