- Subscribe to RSS Feed
- Mark Topic as New
- Mark Topic as Read
- Float this Topic for Current User
- Bookmark
- Subscribe
- Mute
- Printer Friendly Page
Update of front-panel indicators is lagging when testing functions in vendor-supplied DLL
Solved!03-25-2016 11:41 AM
- Mark as New
- Bookmark
- Subscribe
- Mute
- Subscribe to RSS Feed
- Permalink
- Report to a Moderator
I'm looking to see if anyone can explain an odd LabVIEW display behavior that I'm seeing when testing some timeout functions in a third-party DLL. I have a work-around in place but I'd still like to know why, without the work-around, the information displayed by the front-panel indicators is not synchronized with what's happening in the execution of the VI even though I've tried all sorts of things to enforce synchronization. Note that to run this VI in a useful manner, you will need to be able to communicate with a Galil motion controller over an Ethernet connection and that will, for the most part, limit this discussion to what the experts among you know to be happening under the hood of LabVIEW in situations like this.
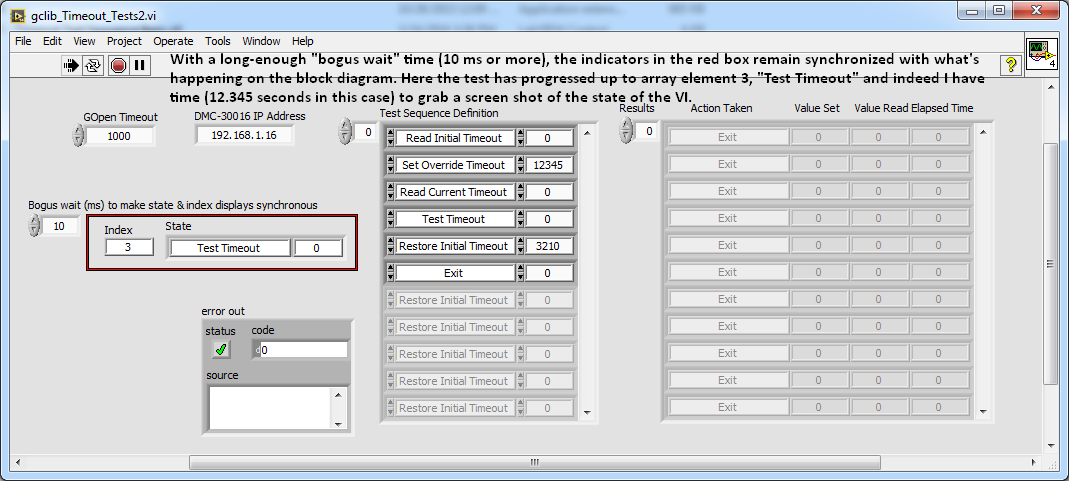
This is what the VI looks like when my work-around (Bogus wait added) is active. It is a small state machine that uses the elements of the "Test Sequence" array to tell it what to do at each step of its execution. Here it reads an initial timeout value, sets a new timeout value, reads it back, tests the timeout by requesting a READ of the controller (without having first asked it to say anything), followed by restoring the initial timeout and then stopping. The two indicators in the red rectangle are there to show the current execution state and it is this pair of indicators which do not remain synchronized with the actual program state.
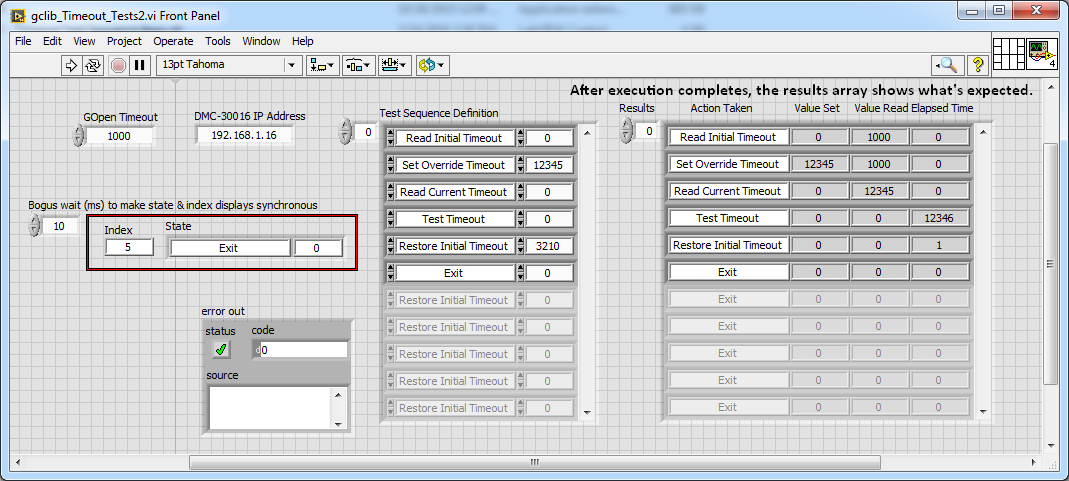
When execution completes this is what's seen.
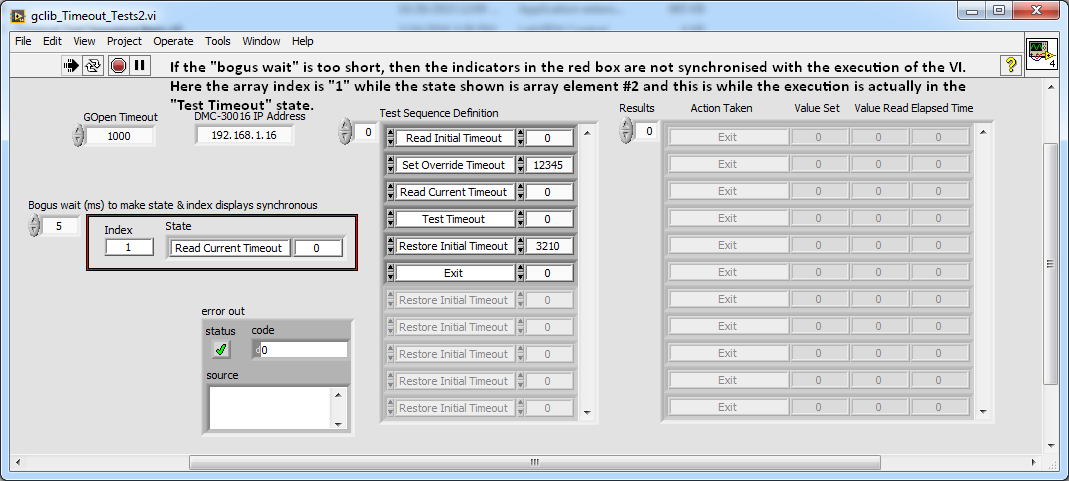
If the bogus wait time is too short, then the indicators are not synchronized with the program state or in this case, with each other. Note that the only time the VI display is static enough for me to grab a screen shot like this is during the "Test Timeout" period. When the timeout eventually occurs, things become synchronized and the same results are displayed.
Here is the code. I'm also attaching a zipped folder with the code just because I don't know if snippets are smart enough to include any DLLs referenced by the call-library nodes.
Here on the left-side of the FOR loop the "State" and "Index" indicator terminals can be seen. The "Bogus Wait" needed to make the indicators work synchronously appears below in the same area. Before coming up with this "fix" the things that I tried, which did not work, were:
- adding the flat sequence structure seen here with the indicators in its first panel
- Using property "value" input nodes linked to the two indicators with their error outputs daisy-chained to the error input on the "G Read" (timeout test) function.
- setting the indicators for "synchronous display" (apparently this setting actually only works with multi-threaded code, which I don't believe this to be)
- setting the "defer front panel updates" property to false
One thing else that did work was connecting a "probe" to any data path on the input side of the conditional frame. I figured it also cause a few milliseconds of delay like the wait.
My best guess at what's going on is that display updates are "launch and forget" actions that happen on parallel execution paths within the single execution thread and they depend on getting a few time slices from the main process to complete. But when the main process calls an outside library, that outside library does not know to share time with any other processes that might be running within the same thread. Does any of this make sense?
Solved! Go to Solution.
03-25-2016 11:52 PM
- Mark as New
- Bookmark
- Subscribe
- Mute
- Subscribe to RSS Feed
- Permalink
- Report to a Moderator
It's because all of those CFLN calls to the dll are set to run in the UI thread (at seen by the orange color to the top of the node.)
If they are eating up cycles in the UI thread, they may not be leaving enough cycles for LabVIEW to do UI updates of the front panel.
What do these 3rd party dll's do? Do they need to run in the UI thread? Is there a problem with putting in a wait so that the dll's aren't hammering the UI thread?
03-26-2016 11:15 AM
- Mark as New
- Bookmark
- Subscribe
- Mute
- Subscribe to RSS Feed
- Permalink
- Report to a Moderator
Outstanding! You nailed it! I changed the DLL calls from "Run in UI thread" to "Run in any thread" and the indicators now update as you would think they should. This also fixes another behavior I was seeing with this VI where sometimes the front panel would, during the timeout wait, get marked as being non-responsive and the mouse cursor would go into its circling/busy state. I must admit that I am very much the novice when it comes to setting up and using the call-library functions. The people who supplied the library also provided some instructions on how to generate the LabVIEW interface VIs using the import wizard and in those instructions they said to leave it set to the "Run in UI thread" default setting and I did not have the knowledge to question that. I learned something today. I will need to dig more into this particular setting and see what other ramifications it might have. Thank you!
03-26-2016 04:57 PM
- Mark as New
- Bookmark
- Subscribe
- Mute
- Subscribe to RSS Feed
- Permalink
- Report to a Moderator
While changing the call library node to run in any thread, fixed your problem, there is a reason that the setting to run the Call Library nodes in the UI thread actually exists. A DLL needs to have been programmed for full reentrant execution in order for the Call Library node to be allowed to change to "run in any thread". Otherwise you can run into race conditions, bad behaviour, or even crashes.
If a DLL is reentrant safe can only be determined when looking at the source code or when the original programmer does a well informed statement that his DLL is that way. So you may have solved your problem but may have introduced another less obvious problem instead if the DLL is not written for that.
03-27-2016 12:14 PM
- Mark as New
- Bookmark
- Subscribe
- Mute
- Subscribe to RSS Feed
- Permalink
- Report to a Moderator
Thanks Rolf. I got in and read what I could find on this setting and the LabVIEW help topic on the matter, Configuring for Multiple Thread Operation, echos your warnings. I have no idea how this DLL was written and probably won't be able to find out. It does (obviously) do calls to the Windows network interface and while I suspect that the Windows network interface is fairly robust, I don't know what all it will tolerate. What I do have working in my favor is that I'm using a single non-rentrant VI as an "action engine" interface to the the DLL so that it will enforce serialization of any and all calls to the DLL's various functions. In any case, I need to do some testing.
Thanks,
Warren
03-28-2016 07:25 AM
- Mark as New
- Bookmark
- Subscribe
- Mute
- Subscribe to RSS Feed
- Permalink
- Report to a Moderator
Well if you can guarantee to call any and all DLL functions from within this single non-reentrant Action Engine, then you basically are already protecting the calls to the DLL from reentrant executation. The only thing you need to verify then is that you have nowhere inside that action engine two or more Call Library Nodes that can execute at the same time and you should be fully protected even if the DLL is not multithreading safe.
03-31-2016 11:25 AM
- Mark as New
- Bookmark
- Subscribe
- Mute
- Subscribe to RSS Feed
- Permalink
- Report to a Moderator
Just as a followup to what I've found for this Galil "gclib" library and LabVIEW 2014, using my action-engine approach I can setup all the DLL calls but one for "any thread" execution and so far it all seems to run fine, even with a fair amount of beating on it. But the call to close the communication channel (also buried within the action engine) has to be setup to run in the UI thread or else it will cause LabVIEW to crash every time. I don't know why it's this way but given it's placement in the scheme of things, I'm also not going to worry about it.


