- Subscribe to RSS Feed
- Mark Topic as New
- Mark Topic as Read
- Float this Topic for Current User
- Bookmark
- Subscribe
- Mute
- Printer Friendly Page
Plot a text on XY Graph
Solved!04-20-2016 08:01 AM
- Mark as New
- Bookmark
- Subscribe
- Mute
- Subscribe to RSS Feed
- Permalink
- Report to a Moderator
Hello,
Does exist some technique that allow to plot a text note on XY Graph.
For example text "AAAAAA" put close to left-top corner of XY Graph.
Thanks.
Solved! Go to Solution.
04-20-2016 08:39 AM
- Mark as New
- Bookmark
- Subscribe
- Mute
- Subscribe to RSS Feed
- Permalink
- Report to a Moderator
Yes - there is a property of the XY graph called PlotImages.front. You would use the picture functions to create an image with text, lines, shapes, or whatever else, and set that image to the graph using a property node.
There are some good examples in this thread:
https://lavag.org/topic/17756-xy-graph-programmatically-add-point-labels/
04-20-2016 08:52 AM
- Mark as New
- Bookmark
- Subscribe
- Mute
- Subscribe to RSS Feed
- Permalink
- Report to a Moderator
04-20-2016 08:59 AM
- Mark as New
- Bookmark
- Subscribe
- Mute
- Subscribe to RSS Feed
- Permalink
- Report to a Moderator
Gerd's suggestion is the correct one. Here is a link on how to add annotations to your plot. It says "waveform graph" but the property calls are the exact same.
http://digital.ni.com/public.nsf/allkb/FB0063E1BC9AD54B8625751C00202C81
04-20-2016 09:25 AM
- Mark as New
- Bookmark
- Subscribe
- Mute
- Subscribe to RSS Feed
- Permalink
- Report to a Moderator
BowenM a écrit :Gerd's suggestion is the correct one. Here is a link on how to add annotations to your plot. It says "waveform graph" but the property calls are the exact same.
http://digital.ni.com/public.nsf/allkb/FB0063E1BC9AD54B8625751C00202C81
Thanks GerdW and BowenM,
I've just tried this example (in my LabVIEW 2015 the property is a little bit different).
Unfortunately I don't see annotation.
What is wrong in my setup ?
04-21-2016 02:24 AM
- Mark as New
- Bookmark
- Subscribe
- Mute
- Subscribe to RSS Feed
- Permalink
- Report to a Moderator
Hi,
It looks like the Annotation is linked with a plot. When you insert a Plot(0) to the graph, the annotation will appear.
Regards,
Marc
04-21-2016 03:24 AM
- Mark as New
- Bookmark
- Subscribe
- Mute
- Subscribe to RSS Feed
- Permalink
- Report to a Moderator
Marc67 a écrit :Hi,
It looks like the Annotation is linked with a plot. When you insert a Plot(0) to the graph, the annotation will appear.
Regards,
Marc
Thanks Marc,
Resolved, the problem was in incorrect coordinate settings.
I sought that they are in pixel, whereas they are in scale units, so values 20,20 were out of scale.
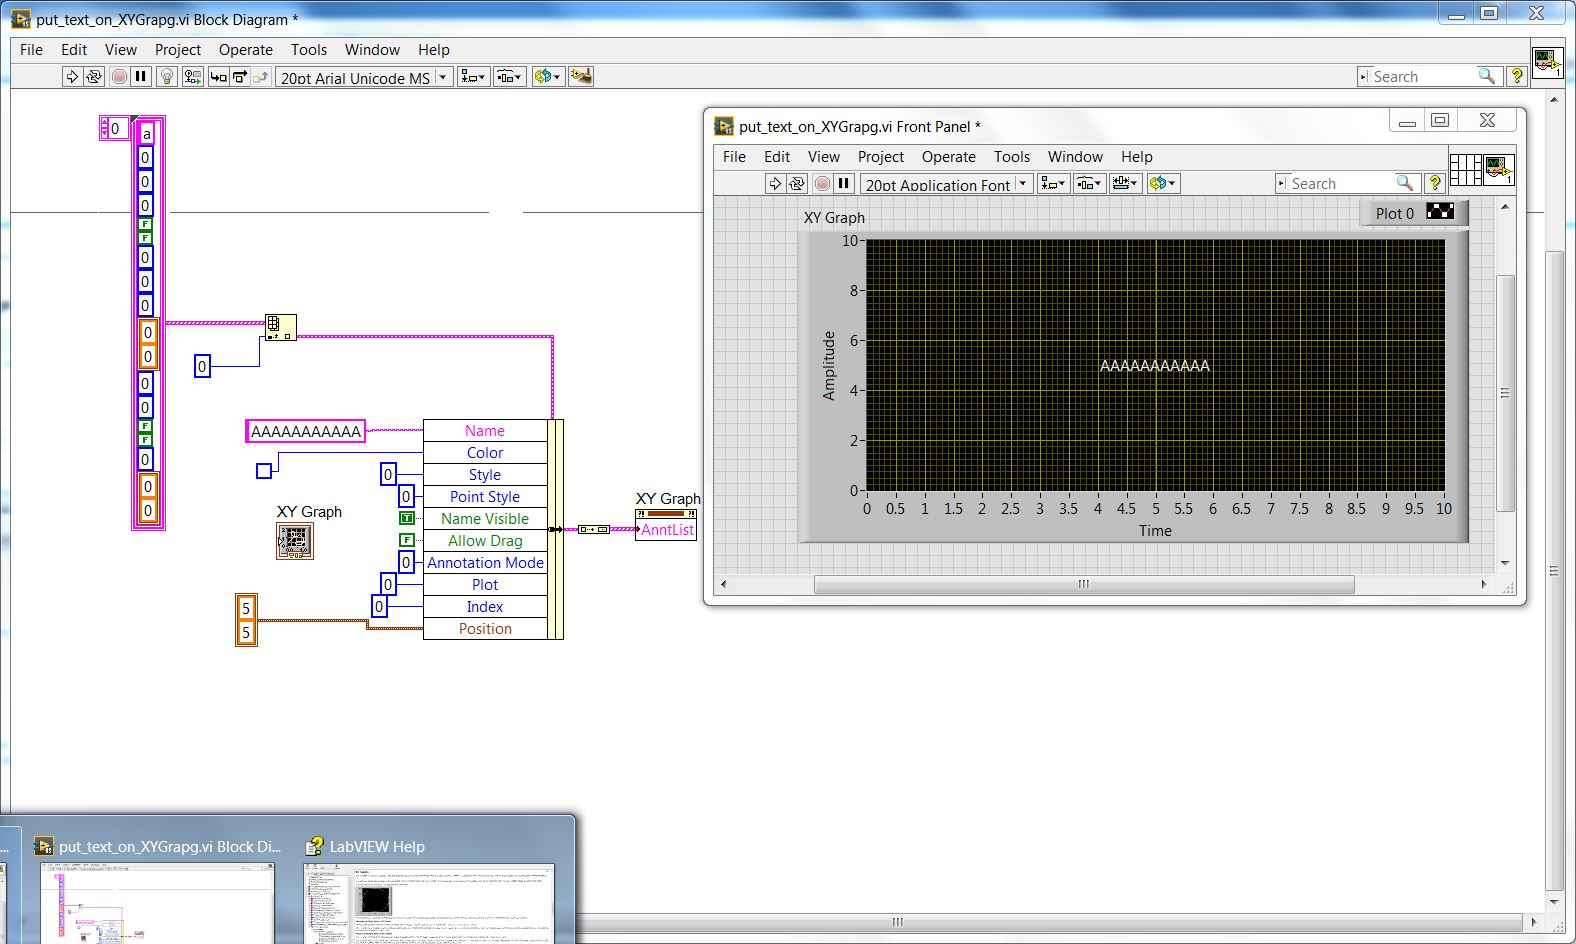
Here is as it looks.
What is a bit annoying in this apporoach, it requires rather significant staff for relatively simple operation:
- Generate constant of type AnntList
- Extract an element from array AnntList
- Create a claster of type "AnntList element"
- Assign values to this cluster (at least between "Name" and "Position" fields)
- Transform this clster in array
- and finally apply it to AnntList property
04-21-2016 04:12 AM
- Mark as New
- Bookmark
- Subscribe
- Mute
- Subscribe to RSS Feed
- Permalink
- Report to a Moderator
Here is probably the simplest version (that uses In Place Element Structure)
Anyway it requires to assign all fields between "Name" and "Position"
04-21-2016 07:20 AM
- Mark as New
- Bookmark
- Subscribe
- Mute
- Subscribe to RSS Feed
- Permalink
- Report to a Moderator
Actually the shortest version is here.
The Bundle By Name block allows to limit the number of properties that user want to change to a strict minimum.
Then the property at the position X can be easily replaced by clicking on the position X and selecting some another property from the list that opens
04-29-2016 02:06 AM
- Mark as New
- Bookmark
- Subscribe
- Mute
- Subscribe to RSS Feed
- Permalink
- Report to a Moderator
Previous version is erroneous - it works only if an annotation already exists on graph.
If no annotation it doesn't work.
Here is the solution for empty graph:


