- Subscribe to RSS Feed
- Mark Topic as New
- Mark Topic as Read
- Float this Topic for Current User
- Bookmark
- Subscribe
- Mute
- Printer Friendly Page
Make BD space for indicators trick (FOR loop + Case structure combo)
Solved!07-27-2017 08:03 AM - edited 07-27-2017 08:06 AM
- Mark as New
- Bookmark
- Subscribe
- Mute
- Subscribe to RSS Feed
- Permalink
- Report to a Moderator
Hello,
I am interested in your opinions and suggestions for better handling of larger number of indicators. Let me explain the situation, then I will show some relevant code to explain better what I do.
So, I have developed an application where I interface several cDAQ modules, 4 RS232 units, etc. The GUI represents the "pipe and instrumentation diagram (P&ID)", which our users and engineers are familiar with. In my application I use 3 TAB pages, the first page shows the whole P&ID, the two others give other info to the users via other VIs which are dynamically called and inserted into subPanels. The monitor size is 24 inches widescreen (1920 x 1200 pixel).
The main page where I have the P&ID, and managed to create a logical and easy to "look through" GUI, hiding most of the settings input into pop-up windows via runtime shortcuts menus. All main menu buttons are auto hidden, and they slide in when the mouse cursor pulled to the side, a kind of auto-hiding sidebar (using some runtime moving SplitterBars tricks), for further decreasing the GUI elements not always needed to be visible...
But still, this main page is required to show to the user about 40 (mostly numeric) indicators (system style). Due to the fact that LabVIEW (and I think also NXG 😞 ) lacks the feature to use clusters which can have independent elements on the Front Panel, I cannot group (most of) these 40 indicators into clusters (they are at very different places scattered around on the FP).
I know, I know, we can use a classic cluster and make the border/bg invisible, but still this approach would create an "overlapping elements, GUI nightmare" on my FP.
So my basic problem was that, I wanted to keep my main VI BD neat and small enough (now it is like 1.5 monitor in vertical, and 1.1 monitor in horizontal), and these 40 individual numeric indicators on my BD would waste away lots of space...
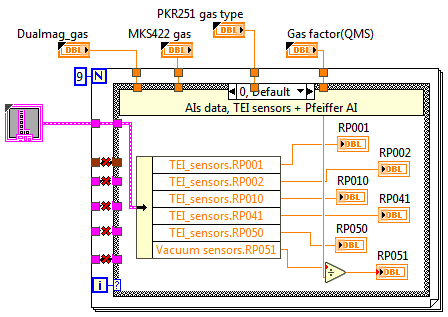
My final idea was that, ok, not the nicest solution, but I can just use an outer fixed iteration FOR loop, and inside a CASE structure. Plus, the iteration terminal connected to the Case selector (cases named as 0 to N-1), see the example snippet below. I just bundle out by names the different data lines in this "Display" loop in my main VI BD, and connect the data by wire to the ~40 different indicators. Also, I can do some final scaling here too before presenting data. In this way I can easily see through the different (commented) cases, where the indicators are grouped logical way. So easy to debug, etc.
All this works fine, no problem. I just wonder, is this an "OK" trick to do (if we cannot use the cluster approach), or can cause problems (performance wise, etc)? Of course, I would never design a GUI where much more than 40 values are present at the same time, I was at "the edge". I guess I could have used some SubPanel or the above mentioned invisible cluster tricks, but I decided to go in this KISS way 🙂
What is your opinion? I hope I did not explain it too much? Sorry for the long description! 😄
Thanks!
Edit: logically would be identical to use a mini state machine to save space on the BD, so using an enum (or string) and just a While loop + Case structure inside, stopping the loop from the last case. Easier to debug and scale up...
Solved! Go to Solution.
07-27-2017 09:09 AM
- Mark as New
- Bookmark
- Subscribe
- Mute
- Subscribe to RSS Feed
- Permalink
- Report to a Moderator
I don't think there is anything wrong with your solution. This loop would probably take about none time to execute, so there is no performance problem (other than single LV GUI thread trying to do something with all those controls - but this is just general LV problem). It's also readable and maintanable. The only problem is a need to do all the coding and wiring to put this together.
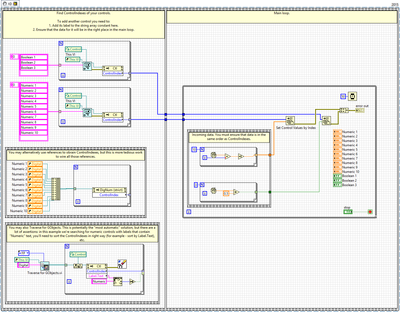
That being said, for the sake of example, I've attached solution using Set Control Values by Index primitive. It's not better, it's just alternative which might be more convenient in some cases:
- Tags:
- update indicators
07-27-2017 09:20 AM - edited 07-27-2017 09:21 AM
- Mark as New
- Bookmark
- Subscribe
- Mute
- Subscribe to RSS Feed
- Permalink
- Report to a Moderator
Thanks for the example! Looks interesting, I actually never ever used the "Set Control Values By Index" function. Its help says it has better performance compared to Value property nodes, which I avoid to use for such purposes...
07-27-2017 09:43 AM
- Mark as New
- Bookmark
- Subscribe
- Mute
- Subscribe to RSS Feed
- Permalink
- Report to a Moderator
07-27-2017 09:57 AM
- Mark as New
- Bookmark
- Subscribe
- Mute
- Subscribe to RSS Feed
- Permalink
- Report to a Moderator
I have used similar methods to bundle up references and use the reference in a sub-VI to update the GUI but if you have a situation where property nodes are too slow and another approach to the "divide and conquer" approach is the topic of this NI Week paper I wrote.
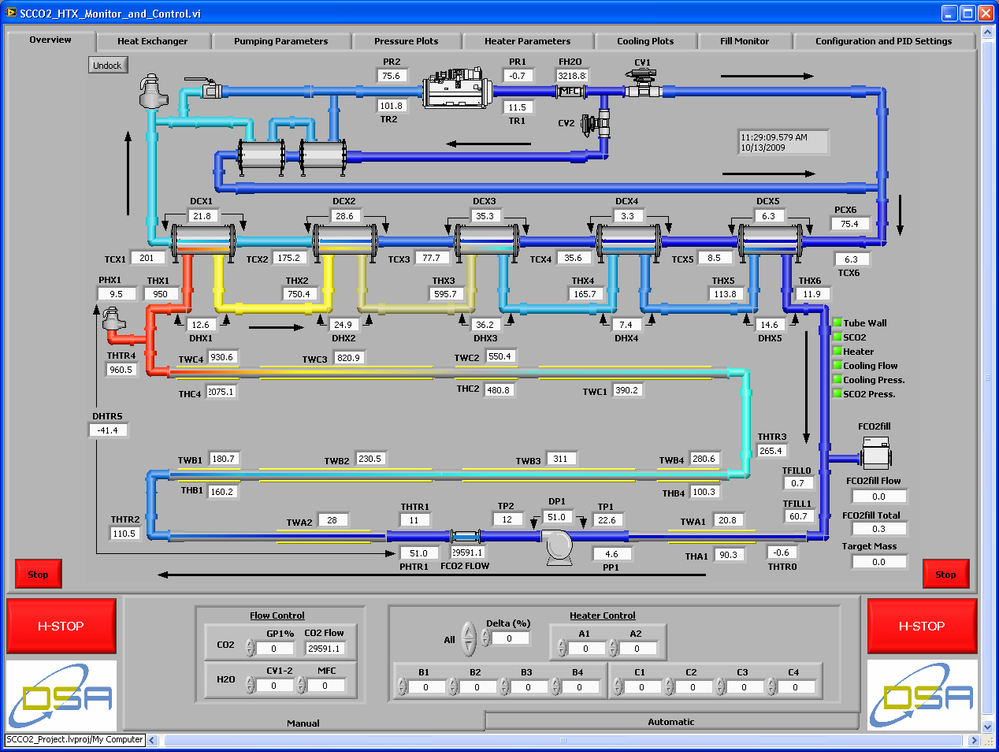
I offer an overview P&ID with numerics along with a XControl that I used to illustrate temperature gradiants across heat exchangers.
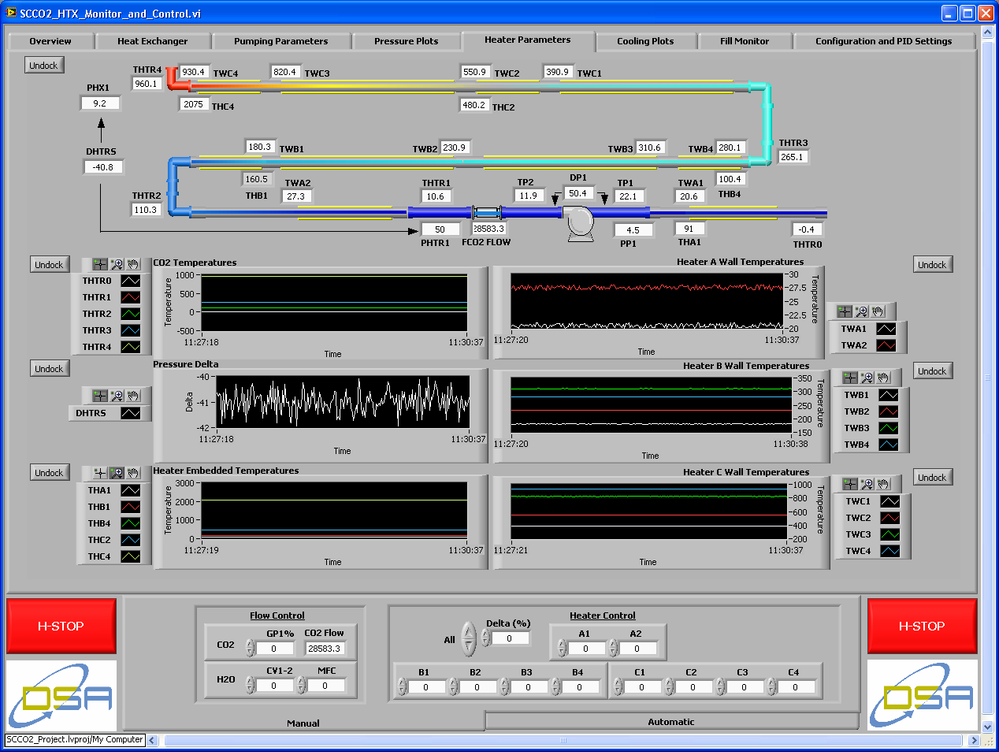
Each of the sub-systems has its own tab that shows the P&ID for the sub-system along with charts.
Each of the charts are in a sub-panel that I le the user "undock".
So the user can drill down into any sub-system that want to watch.
Because all of the tabs are sub-panels that include sub-panels, the VIs in the sub-panels have only the indicators associated with the sub-system. That means, aside from the overview screen all of the GUI VIs have just a handful of indicators to update.
Ben
07-27-2017 11:04 AM - edited 07-27-2017 11:11 AM
- Mark as New
- Bookmark
- Subscribe
- Mute
- Subscribe to RSS Feed
- Permalink
- Report to a Moderator
Thanks for the interesting info!
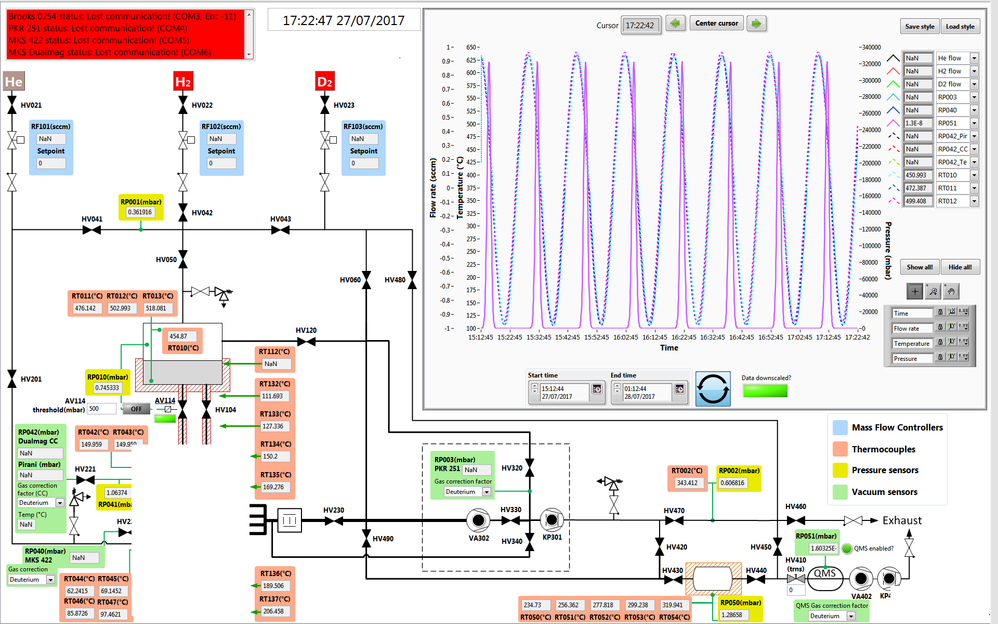
Then I also share my GUI here, note that, I had to delete with Paint some of the "secret" info from it 🙂
But the rest is just general P&ID. For the static part of the GUI I used Microsoft Visio, then exported it into properly sized png with required resolution. Once I had a look at the NI DSC toolkit, but I have found the looking too "bulky", and specially the hand valve controls were just unusable! Very difficult to click on them with the mouse, if you find accidentally the empty parts at the middle of the glasshour shaped controls.
So I had to make my own hand valve controls, using LV picture control, with 3 states: closed, open, undefined, mimicking our Siemens PCS system style here in the lab (black, green, yellow). Since it is a rectangular picture control, MUCH easier to catch them with the mouse:
The main page of the GUI (running as fullscreen, but can be minimized). Note that, the XY Graph part at the top right with all the additional tools (save/load Graph curve styles and selected curve list to ini files, auto-update graph, selectable time interval to show data of it, etc) is actually a separate VI, called dynamically and inserted into a system style SubPanel (so later additional VIs could be presented here if needed during runtime).
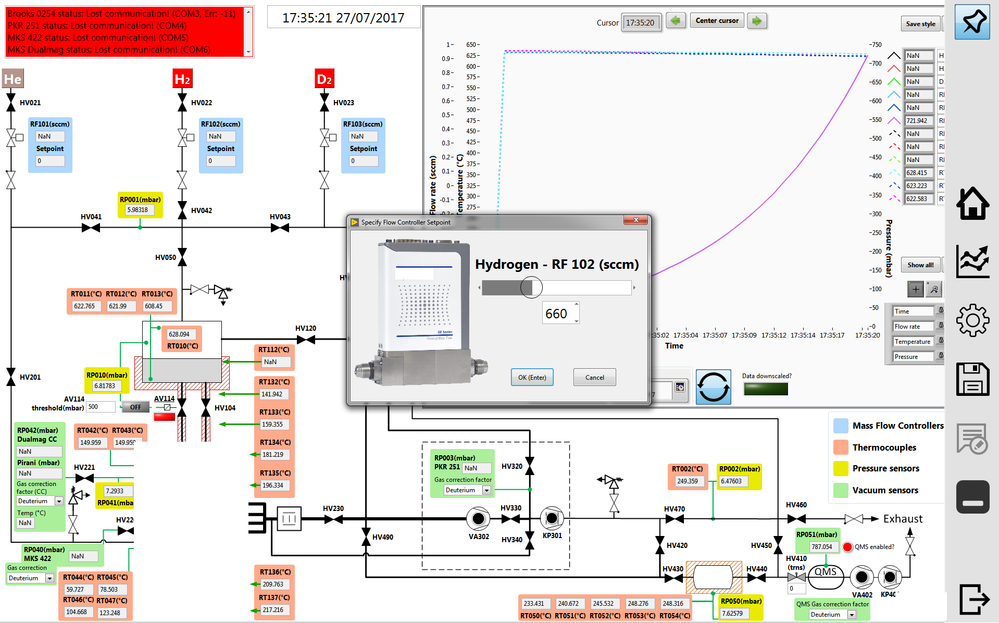
And here the same GUI, showing the right Taskbar with auto-hide off setting, and the mass flow controller pop-up dialog where the user can easily and quickly modify flow rates:
Actually I only run this so far in simulation mode, that is why the top left RS232 "info window" is in red, the application complains about it cannot find the RS232 units. At another page, the user can re-initialize such RS232 units, if a cable gets broken, or unit gets changed, etc, on the fly.
The second part of the project will be to create another application to present the experimental data. The idea is that, using the same GUI, the user can load the recorded TDMS files after experiments, and "replay" them, with time speed up, etc... Like replaying a football match in the TV, with variable speed, pause-able, etc...
Edit: the GUI colors were required by the end-user 😄
