Turn on suggestions
Auto-suggest helps you quickly narrow down your search results by suggesting possible matches as you type.
Showing results for
Topic Options
- Subscribe to RSS Feed
- Mark Topic as New
- Mark Topic as Read
- Float this Topic for Current User
- Bookmark
- Subscribe
- Mute
- Printer Friendly Page
I keep getting a Nyquist error when running a stopband filter
Member
09-29-2006 02:55 PM
Options
- Mark as New
- Bookmark
- Subscribe
- Mute
- Subscribe to RSS Feed
- Permalink
- Report to a Moderator
I'm building a filter VI, the heart of which is a Digital IIR
filter.vi. I created a cluster to provide the sub-vi with
topology (want Butterworth), type (bandstop), order, lower cutoff
frequency, upper cutoff frequency, PB ripple (using default), and
stopband attenuation (using default). The incoming data
spreadsheet samples at 1200 Hz, but I don't see anywhere in the sub-vi
to indicate sample frequency. Every time I run the VI, I get an
error message:
0 <= fc <= fs/2
Which I understand to mean that the lower cutoff frequency must be equal to or below half the sampling frequency. My lower cutoff frequency is 58 Hz, while my sample frequency is 1200 Hz. I don't understand why I'm getting this "Nyquist criterion" error. Any ideas?
0 <= fc <= fs/2
Which I understand to mean that the lower cutoff frequency must be equal to or below half the sampling frequency. My lower cutoff frequency is 58 Hz, while my sample frequency is 1200 Hz. I don't understand why I'm getting this "Nyquist criterion" error. Any ideas?
Knight of NI
09-30-2006 11:26 AM
Options
- Mark as New
- Bookmark
- Subscribe
- Mute
- Subscribe to RSS Feed
- Permalink
- Report to a Moderator
The Digital IIR Filter function has as it's default signal input, a waveform data type. The waveform data type is a cluster with a y array, dt, and t0 so the function is able to get sample frequency from that. If you have just an array of DBLs wired to the signal input, you will need to convert that to a waveform date type. This can be done with the Build Waveform function. The Build Waveform function is just a specialized Bundle By Name. You can select the inputs Y and dt to provide the minimum information required for the filter to work.
10-04-2006 11:38 AM
Options
- Mark as New
- Bookmark
- Subscribe
- Mute
- Subscribe to RSS Feed
- Permalink
- Report to a Moderator
Thanks for the suggestion. I created a "Build Waveform" function, but the wire going to the dt
is always broken. What I did: I have a spreadsheet with 6 columns
of data, and I want to plot column 3 (force) on the Y axis, and column
2 (time, in seconds) on the X axis. And I also want to stopband
filter the data because the force trace is really noisy.
I transformed the spreadsheet so that columns are now rows, and then used the Index Array fuction to separate those two rows from the original six. I'm guessing that Y is exactly what it sounds like: the array for the Y axis of a plot. But what is dt? It sounds like slope, or change in time, or something that isn't an array of time count. Any idea what I'm doing wrong?
I transformed the spreadsheet so that columns are now rows, and then used the Index Array fuction to separate those two rows from the original six. I'm guessing that Y is exactly what it sounds like: the array for the Y axis of a plot. But what is dt? It sounds like slope, or change in time, or something that isn't an array of time count. Any idea what I'm doing wrong?
Knight of NI
10-04-2006 11:53 AM - edited 10-04-2006 11:53 AM
Options
- Mark as New
- Bookmark
- Subscribe
- Mute
- Subscribe to RSS Feed
- Permalink
- Report to a Moderator
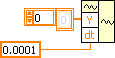
dt is the time interval between samples. You should turn on Context help and move your mouse over the Build Waveform function. In the help window, you can click the 'Click Here for More Hlpe' link and get a full expanation. Since you haven't mentioned what type of data you've wired to this input, I don't know exactly what you've done wrong but dt is just a floating point number as shown below.
Message Edited by Dennis Knutson on 10-04-2006 10:53 AM
10-04-2006 03:52 PM
Options
- Mark as New
- Bookmark
- Subscribe
- Mute
- Subscribe to RSS Feed
- Permalink
- Report to a Moderator
The Y component of the waveform is just numbers: 0.0012, 0.0013,
0.0012, 0.0012, and so on another 7196 times. To obtain the time
between samples (dt), I had a cell in the spreadsheet with the
sampling frequency (1200 Hz). I used an index array function to
grab that number, and then I divided 1 by the sample frequency to calculate the time between samples. This I wired into the dt component of the waveform. Unfortunately the run button is still broken... any ideas?
Thanks much!
Thanks much!
Knight of NI
10-04-2006 04:03 PM
Options
- Mark as New
- Bookmark
- Subscribe
- Mute
- Subscribe to RSS Feed
- Permalink
- Report to a Moderator
A broken run button is different than a broken wire and it seems you have most of the Build Waveform correct except you have a t0 input but nothing wired to it. If you don't want to wire in a timestamp value, drag the Build Waveform down to eliminate the input or right click on t0 and select 'Remove Element'. Anytime you have a broken arrow, you can click on the arrow to get a description of what the problem is. In this case, it would say: 'Build Waveform: contains unwired or bad terminal'.
Member
11-28-2006 09:12 AM
Options
- Mark as New
- Bookmark
- Subscribe
- Mute
- Subscribe to RSS Feed
- Permalink
- Report to a Moderator
Hi Dennis,
i have also a problem with filtering. Maybe i should explain my application.
I am doing period measurements with a counter. The result of this is an array. (DBL)
I am saving this values to a *.txt file and my colleague uses Matlab to do some calculations on the data. (i.e. FFT)
Now the problem is that there are some low frequencys in the signal which is deranging. So i am trying to filter
this low frequency out. But i don't now how to do that. I am not used to filtering and so on.
Do you have an example?
regards
Jens
