- Subscribe to RSS Feed
- Mark Topic as New
- Mark Topic as Read
- Float this Topic for Current User
- Bookmark
- Subscribe
- Mute
- Printer Friendly Page
- « Previous
- Next »
How to plot this data in 3d curve in labview 5.1?
09-27-2005 01:00 PM
- Mark as New
- Bookmark
- Subscribe
- Mute
- Subscribe to RSS Feed
- Permalink
- Report to a Moderator
please
help me !!
Thanks a lot for all!
Rafael
Brasil
Labview 5.1
09-28-2005 05:05 AM
- Mark as New
- Bookmark
- Subscribe
- Mute
- Subscribe to RSS Feed
- Permalink
- Report to a Moderator
09-28-2005 07:28 AM - edited 09-28-2005 07:28 AM
- Mark as New
- Bookmark
- Subscribe
- Mute
- Subscribe to RSS Feed
- Permalink
- Report to a Moderator
Hi Rafael,
1) Please keep in mind the contributors to this Exchange are (for the most part) volunteers. There is no guarentee any question will be answered. You can not expect a quick answer.
2) This talk of a professor makes me think this is a homework assignment and I do NOT want to help you cheat.
3) Once you have a valid answer to the initial question, it is not un-common for people to stop looking at that thread. If you have a new question, then start a new thread.
4) Until recently the hardware required to do 3D plotting fast did not exist. This means that there are not a lot of people that know how to use the 3D graph. I beleive there are less than 10 contributors to this Exchange that know the 3d Graph and are willing to answers questions regarding it. So do not expect non-3D-Graph user to be reading your questions.
5) LV 5.1 is very old. Few of the contributors to this exchange still use that version. When we answer Q's for LV 5.1 we can no longer provide examples.
The following information is intended to be of a general form and you will still have to work if you want to get your graph working.
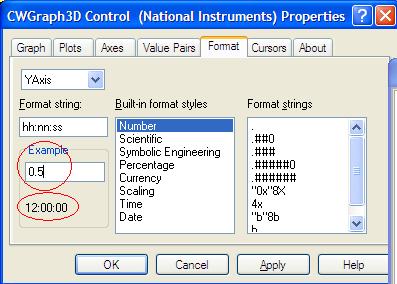
A) When trying to do anything new with a CW 3DGraph I start by opening the CWGraph3D properties screen.

B) The location within this dialog box tells you how to prgramatically access any of the porperties. Stop and take a look at the structure that was used to create your plots and compare that with the tab layout. This relationship is pretty much 1 to 1.
C) I did not know how to display time on a 3D graph so I found the "Format" tab selected a time format and then started entering some values into the "Example" field to see what kind of results I got. After a little playing I realized that the time is expressed in units of days. In the image shown you will see that a value of "0.5" gave me result of 12:00:00. Similarly 0.25 gave 6:00:00.
D) I modified the example I posted earlier to illustrate how I would convert seconds to days. I am including a screen shot showing the results.


Final thought:
You seem to be having trouble getting your time into a numeric format. The VI's in the attached image existed in LV 5.1 and will help you do your time conversion. I will leave that as an exercise for the reader.
Ben
Message Edited by Ben on 09-28-2005 07:29 AM
Message Edited by Ben on 09-28-2005 07:30 AM
Message Edited by Ben on 09-28-2005 07:31 AM
Message Edited by Ben on 09-28-2005 07:33 AM
10-03-2005 06:43 AM
- Mark as New
- Bookmark
- Subscribe
- Mute
- Subscribe to RSS Feed
- Permalink
- Report to a Moderator
Ben
I am going to answer your questions. (Sorry by english).
1)I am doing my final project fof graduation in enginnering,so the teacher is a supervisor,not a teacher. He is like the client.
2)I am using labview 5.1 because this is the only version my univertisty has. And we do a lot of works in labview, and many of these works are in internation articles.
3)I never force anyone to answer my questions,but i only need your help. In the same case i would sahre my knowledge too. To share what we know it is a great thing, anyone have to know all.
Thank you for all and sorru for anything
And i will post a doubt in other post.
Thank you ben
You can count with me
Rafael
Brasil
Labview5.1
- « Previous
- Next »
