- Subscribe to RSS Feed
- Mark Topic as New
- Mark Topic as Read
- Float this Topic for Current User
- Bookmark
- Subscribe
- Mute
- Printer Friendly Page
Finding a voltage in a damped wave (burst sine wave)
07-14-2014 10:25 PM - edited 07-14-2014 10:30 PM
- Mark as New
- Bookmark
- Subscribe
- Mute
- Subscribe to RSS Feed
- Permalink
- Report to a Moderator
I am hoping someone can point me in the right direction. The closest I have seen to my question is this thread. https://decibel.ni.com/content/docs/DOC-23390
It can find the peaks in a damped sine wave but its not quite what I want. I need this for a test I am working on for work. I know labview (CLAD certified) but not so much on signal processing. Normally the engineers have the info I need.
My Setup
I am using a Function Generator to create a transit tone burst. (amplitude, frequency, and pulse width)
The sine wave operates at a certain frequency like 150kHz with a Vpp of 10 volts. I set the burst counter on the generator so that pulse width is a specic time like 5 ms. (count = f*5ms)
This all connects into an osciollocsope to read the signal. I am using a tektronix 460. I set the time divisions for both Verticle/Horizontal. I use the Horizontal at 1ms and the Vertical at 5 Volts. This shows the entire signal on the screen. I am using the external trigger on the Signal Generator to the oscilloscope. I can get labview to read the waveform just fine.
My issue
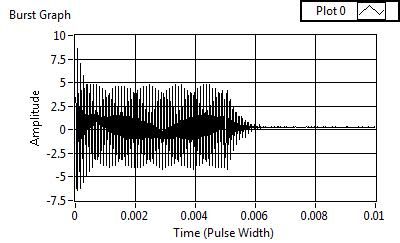
Here is a picture of my waveform. I have an updated waveform but don't have a picture on me at the moment. This waveform below only used a onetime sample the newer one uses envelope sampling at 2000 samples to make the wave much for consistent. Its more of a "straight" line look. As you can see there is incosistent peaks so if I need s pecific voltage it can give me an inconsistent reading. While the newer image is much more accurate it still has jumps in the peaks occasionally.
My Question
I need to find the voltages at different times. Such as 3 ms, 5.2ms, 5.7ms. The problem is the peaks are inconsistent so sometimes the max voltage could be at 5.0ms, or 5.6ms, or many ohter unknowns. I cannot use the oscilloscope to find it because the voltages can jump around. In labview I could check the voltage and check all peaks within the tolerance for the timing allowed but I still find sometimes the peaks are not within that tolerance window so I miss the actual peak voltage. Also I do need to change the VPP on the generator for different measurements so I willl have ot change the time divisions to work for the different measurements. Also need to find the reasonant voltage which I don't know how to do either 🙂 shortly after the 5ms wave.
Any advice? This method needs to be accurate but I don't think I could get new equipment and make my life easier. I am going to have to do many measurements so I am hoping to avoid taking 100 measurements to get only one "real" value (read many points in one spot and take the maximum found out of those 100 which is almost what the envelope reading on the oscilloscope is doing).
Another problem I have is the osciolloscope doesn't decay to 0Volts but like 600mv/-300mv. So that will cause problems with my calculations when a passing value is only within 500mv of the required voltage. Both instruments are calibrated.
Need more infor let me know.
07-16-2014 09:53 AM - edited 07-16-2014 09:55 AM
- Mark as New
- Bookmark
- Subscribe
- Mute
- Subscribe to RSS Feed
- Permalink
- Report to a Moderator
How are you transferring the information to the computer? I am assuming you are using the Tektronix GPIB; is that right? Also, is it a TDS460A?
What's the sample rate from the data you are sending to the computer? Is the data just an array or a waveform?
The easiest way to find the voltage value at X seconds and if your sample rate is Y Hz, would be basically extracting the sample number N = X * Y from the array. I would also like to see the updated waveform you mentioned.
National Instruments

