- Subscribe to RSS Feed
- Mark Topic as New
- Mark Topic as Read
- Float this Topic for Current User
- Bookmark
- Subscribe
- Mute
- Printer Friendly Page
Display Maximum and Minimum values on the waveform
Solved!10-27-2010 04:10 AM
- Mark as New
- Bookmark
- Subscribe
- Mute
- Subscribe to RSS Feed
- Permalink
- Report to a Moderator
Hi, I have a waveform array and wanted to display the max and min values of the graph with arrow. I have tried to change with property node but still i didn't get an expected output.Could someone can help on that?
Attached the vi.
Solved! Go to Solution.
- Tags:
- LabVIEW_Graph
10-27-2010 07:17 AM
- Mark as New
- Bookmark
- Subscribe
- Mute
- Subscribe to RSS Feed
- Permalink
- Report to a Moderator
I ran your VI and it appears to be working, but its hard to realize its working for several reasons:
1. The annotation default color is black, which is difficult to see on the black graph background. Either change the annotation color or change the color of the graph.
2. The y-scale was not set to auto-scale so i had to browse to find my data, which also made it hard to locate the annotations
3. If you do use auto-scale on the y-axis, the annotations will still be hard to see because they will be outside the auto-scaled graph boundaries, I'd recommend manually setting the scales or using the label offset property of the cursors to bring the label into the visible view
Also, each time you're going to append two new annotations to the graph, is this desired? If not, use an annotation cluster constant and wire that into your bundle by names, then build an array with those two annotation clusters.
Hope this helps,
Rob
10-28-2010 12:11 AM
- Mark as New
- Bookmark
- Subscribe
- Mute
- Subscribe to RSS Feed
- Permalink
- Report to a Moderator
Thanks. I have changed as you recomended its working fine.
Need suggestion on this.
1).I ran with different set of arrays but min & max indicator append into the graph at each execution. I tried to initialize the null values at begin of the execution still not working.
2).Is it possible to show the values of the graph points when i move the cursor over the graph datas.
Regards,
Venkat
10-28-2010 06:50 AM
- Mark as New
- Bookmark
- Subscribe
- Mute
- Subscribe to RSS Feed
- Permalink
- Report to a Moderator
See the VI snippet below, it will always draw only the min and max annotations. The reason your previous code was appending new annotations was because you were inserting the new annotations into the existing annotation array (property node read) and then writing that as the new annotation list property. Sorry that in the VI snippet the property node and constant array of annotation clusters got a little mangled.
If you want to show the values of the graph points with the cursor, there are at least two ways to do this. The first is very simple and requires no code, the second requires a bit more code.
The first method:
1. Right click on the graph and select Visible Items > Cursor Legend
2. Right click on the cursor legend and select Create Cursor > Single Plot
3. Right click on the created cursor in the cursor legend and select Bring to Center
4. Drag this cursor around and you'll see the (x,y) data update as you move the cursor (you can change a lot of other properties for the cursor, but I'll let you explore that)
This method is also described here: http://forums.ni.com/t5/LabVIEW/xy-graph-point-tip-strip/m-p/122456
The second method would involve creating a string indicator and populating this string indicator with the (x,y) graph coordinates on each mouse move event for the graph. You could also reposition this string indicator at the cursor location. I would suggest going with the first approach and see if that fits your needs.
Hope this helps,
Rob
10-28-2010 08:25 AM
- Mark as New
- Bookmark
- Subscribe
- Mute
- Subscribe to RSS Feed
- Permalink
- Report to a Moderator
Thanks Rob..1st example working fine, how i expected.
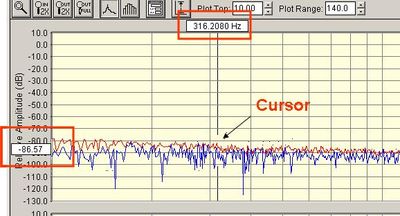
1. cursor legend seems good but my expectation because if i create cursor legend it occupy some space in the front panel that i dont want . see below figure
I hope u would understand my expectation how the values i wanted to display. Need suggestion.
2). Second method is working fine but at execution mode and i dont think its not a good practice to use when u working big applications
10-28-2010 11:19 AM
- Mark as New
- Bookmark
- Subscribe
- Mute
- Subscribe to RSS Feed
- Permalink
- Report to a Moderator
You shouldn't have any problems with the second method in large applications as long as you use the mouse move events efficiently and use a reasonable update rate (about once every 50 - 100 ms should work fine). From your image you have one indicator for x and one for y, another way would be to combine them into one indicator, like "(316.2080 Hz, -86.57)" and you can make the indicator transparent and place it slightly offset from the actual cursor location (so the user can still click on other stuff).


