- Subscribe to RSS Feed
- Mark Topic as New
- Mark Topic as Read
- Float this Topic for Current User
- Bookmark
- Subscribe
- Mute
- Printer Friendly Page
Graph PWM output from arduino mega 2560
02-09-2012 09:46 PM
- Mark as New
- Bookmark
- Subscribe
- Mute
- Subscribe to RSS Feed
- Permalink
- Report to a Moderator
Hi everyone,
How can i visualize the pwm signal generated by the arduino mega, so i can check the duty cicle(0-255) or (0-100%), frequence(hz), etc.
i dont know wich one to use--> waveform chart, waveform graph, digital waveform graph???
thanks
02-10-2012 06:34 PM
- Mark as New
- Bookmark
- Subscribe
- Mute
- Subscribe to RSS Feed
- Permalink
- Report to a Moderator
Hey MecaMax,
It depends how you are reading it back. If you are reading a single sample analog input I would use a waveform chart. Check out this KB which highlights the differences between the graphing options:http://digital.ni.com/public.nsf/allkb/95FEE9F5B252507E862562BA00007657
Principal Software Engineer
NI
02-16-2012 12:06 PM
- Mark as New
- Bookmark
- Subscribe
- Mute
- Subscribe to RSS Feed
- Permalink
- Report to a Moderator
Hi Kevin_F
What i want to do is to Graph the PWM output generated in the vi Pwm Write Pin and see the duty cycle, Frecuency, Period from 0 to 5v. can this be done??
02-16-2012 01:00 PM
- Mark as New
- Bookmark
- Subscribe
- Mute
- Subscribe to RSS Feed
- Permalink
- Report to a Moderator
Mecamex,
It can be done.
I am trying to make a digital read on my photoelectric sensor too. At this time I can graph the digital signal 0-1 on the waveform chart. I am trying to count the RPM on a propeller but I am failing pretty hard to get the frequency and period out of it.
There is a nice example on Labview on how to get that from a sine wave, but if I try with a digital signal it gives me a time out error.
I can share what I have with you. I would love to solve this one.
I am simulating a digital signal using a toggle swtich. I think maybe the way to do this is to use an array.?
04-14-2012 02:15 PM
- Mark as New
- Bookmark
- Subscribe
- Mute
- Subscribe to RSS Feed
- Permalink
- Report to a Moderator
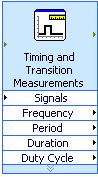
I'm reading de PWM output on a digital input, i have also tried on an analog input, but i cant make the timing and transition Measurements.vi to work.
I want to measure the frecuency and duty cycle, and i have tryed to do it this way.

but as you can see, im getting an error.
Can the TTM be used to measure the pwm signal on an arduino board or its just for the DAQmx?
04-14-2012 06:27 PM
- Mark as New
- Bookmark
- Subscribe
- Mute
- Subscribe to RSS Feed
- Permalink
- Report to a Moderator
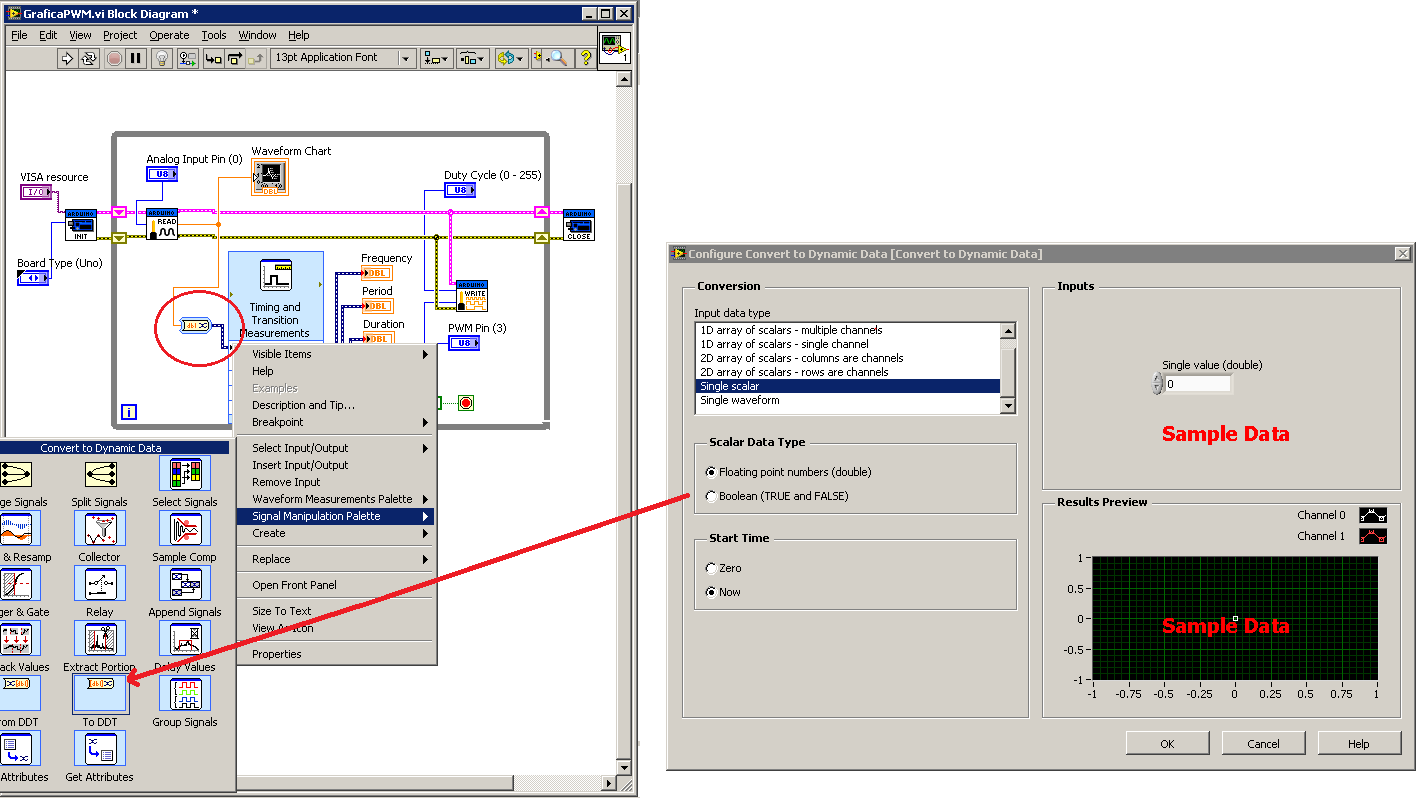
As far as I know, that express VI is expecting a signal datatype but you are just giving it a single scalar number.
Also, Set Digital Pin Mode can be moved outside the loop.
04-14-2012 11:18 PM
- Mark as New
- Bookmark
- Subscribe
- Mute
- Subscribe to RSS Feed
- Permalink
- Report to a Moderator
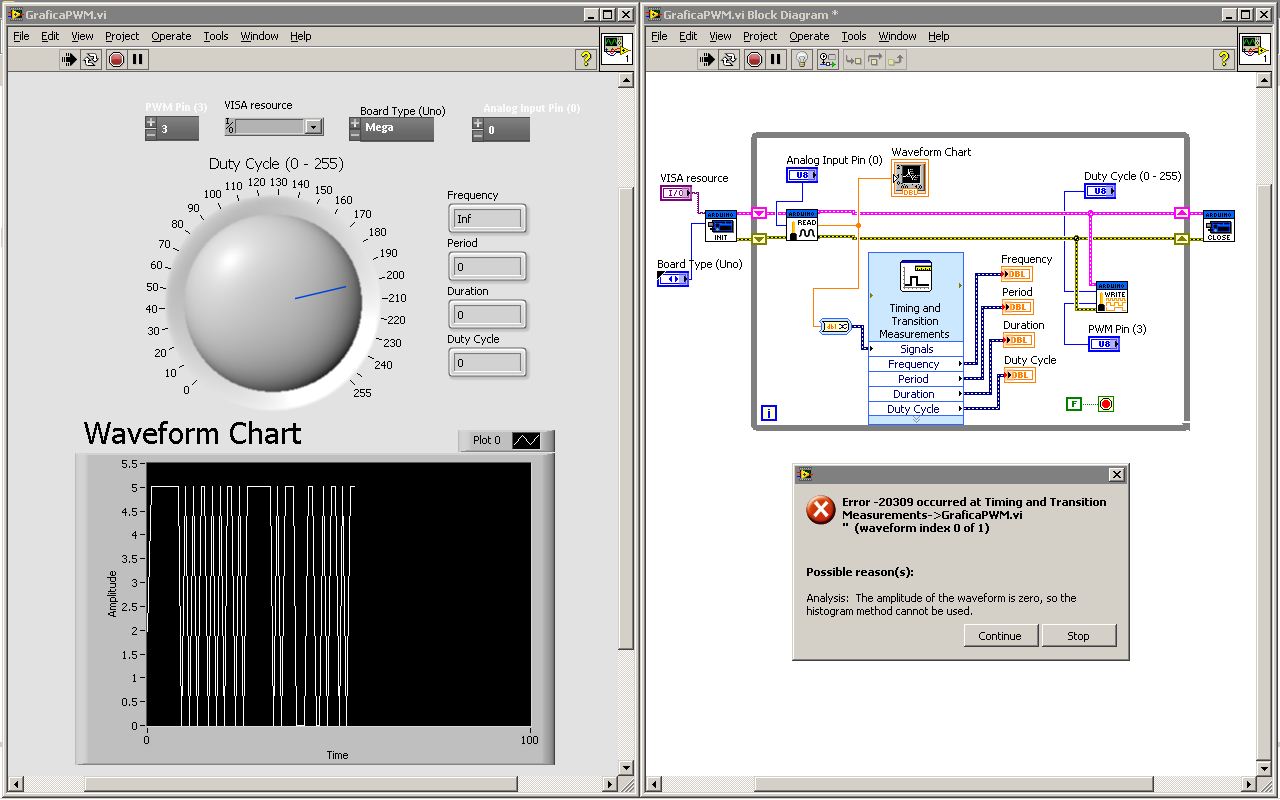
ok, i got it to work but i still can´t measure all the variables. The vi is runing, the arduino board is synchronized and the graph is working but, nothing on the variables.
any other suggestions?????
04-15-2012 01:45 AM
- Mark as New
- Bookmark
- Subscribe
- Mute
- Subscribe to RSS Feed
- Permalink
- Report to a Moderator
You are still only giving it a scalar (a single data point). Nothing can be interpreted from a single data point (when interpreted as a waveform). I haven't worked with waveforms or signals much at all so I can't tell you how exactly you would need to do based on your current data aquisition. Read up about waveforms and see if that helps you any. You probably need to save a whole bunch of values into the waveform datatype (probably requires a shift register) so that you can then analyze the waveform with that express VI.
04-16-2012 10:14 PM
- Mark as New
- Bookmark
- Subscribe
- Mute
- Subscribe to RSS Feed
- Permalink
- Report to a Moderator
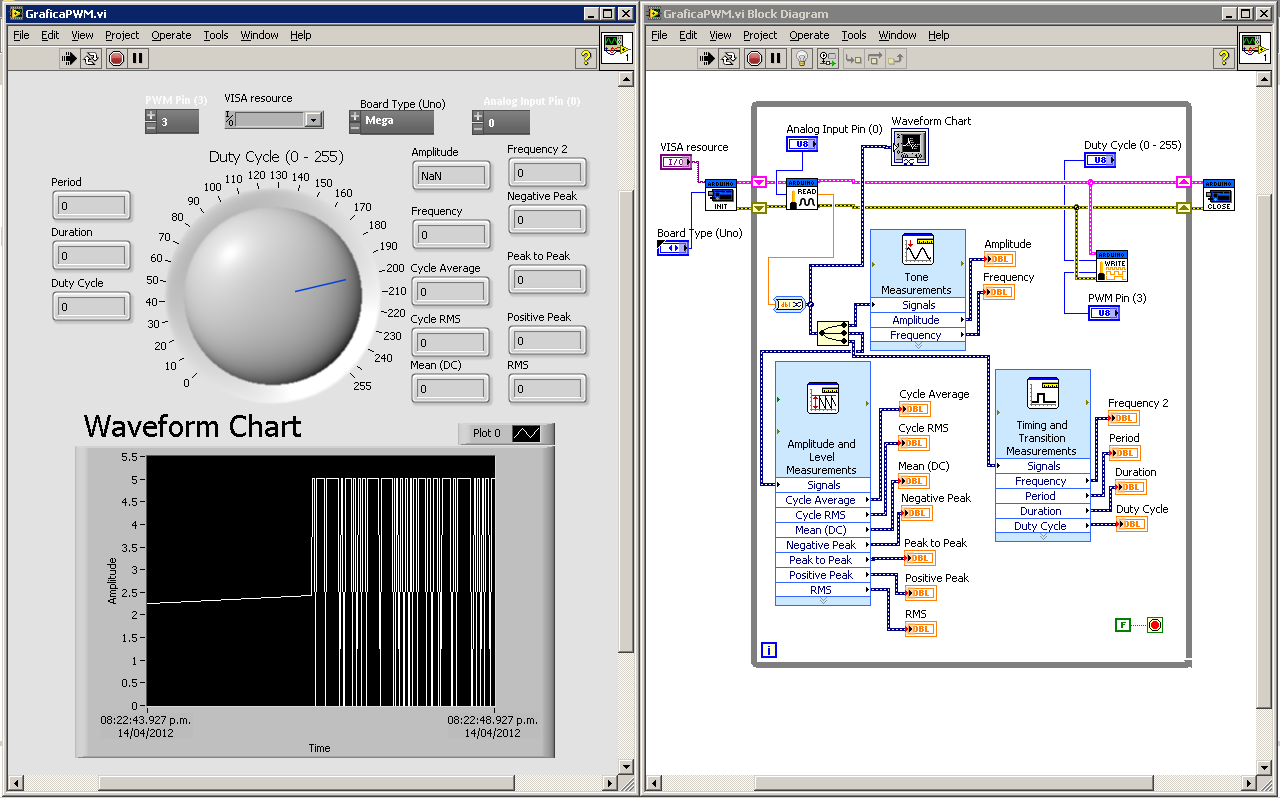
this is part of the program im building, but i have a question.
Do i have to use the Set Digital pin as an input, even for the Read Digital pin.vi?
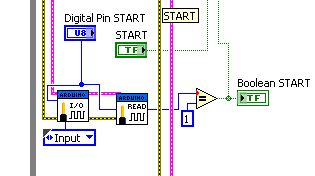
and for the PWM Write pin.vi, do i have to set it as an output as well?
04-17-2012 10:22 AM
- Mark as New
- Bookmark
- Subscribe
- Mute
- Subscribe to RSS Feed
- Permalink
- Report to a Moderator
Yes, any digital reads need to be set as input and any digital writes need to be set as output. But, you only need to set the pin mode once (usually outside the loop immediately after init).
