- New 2,936
- In Development 0
- In Beta 1
- Declined 2,616
- Duplicate 698
- Completed 323
- Already Implemented 111
- Archived 0
| User | Kudos |
|---|---|
| 4 | |
| 3 | |
| 3 | |
| 2 | |
| 2 |
- Subscribe to RSS Feed
- Mark as New
- Mark as Read
- Bookmark
- Subscribe
- Printer Friendly Page
- Report to a Moderator
Graphs and Charts with semi-transparent fill option
It would be nice, if the plot fill cold be set semi-transparent.
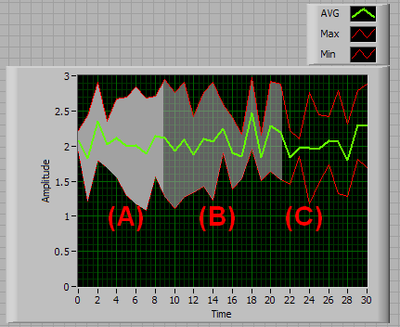
I have to plot minimum, maximum and average. It would give a better impression if the area between minimum and maximum is filled. Unfortunately the fill area hides the grid completely. It would enhance the plot if the fill was semi-transparent and the Grid would shine through.
I don't know how much effort it would take to implement a semi-transparent fill function in LV. If such a semi transparent fill function should be implemented could be implemented easily it should be done easily.
The picture shows a graph with (A) normal fill, (B) semi transparent fill (new idea) , (C) no fill
Does anybody else miss such a semi-transparent fill option (B)?
You must be a registered user to add a comment. If you've already registered, sign in. Otherwise, register and sign in.

