LabVIEW Idea Exchange

cancel
Showing results for 
Search instead for 
Did you mean: 
Mads

Allow graph rescaling and real-time updates in the "Profile buffer allocations" window

Status: Declined

Any idea that has received less than 2 kudos within 2 years after posting will be automatically declined.

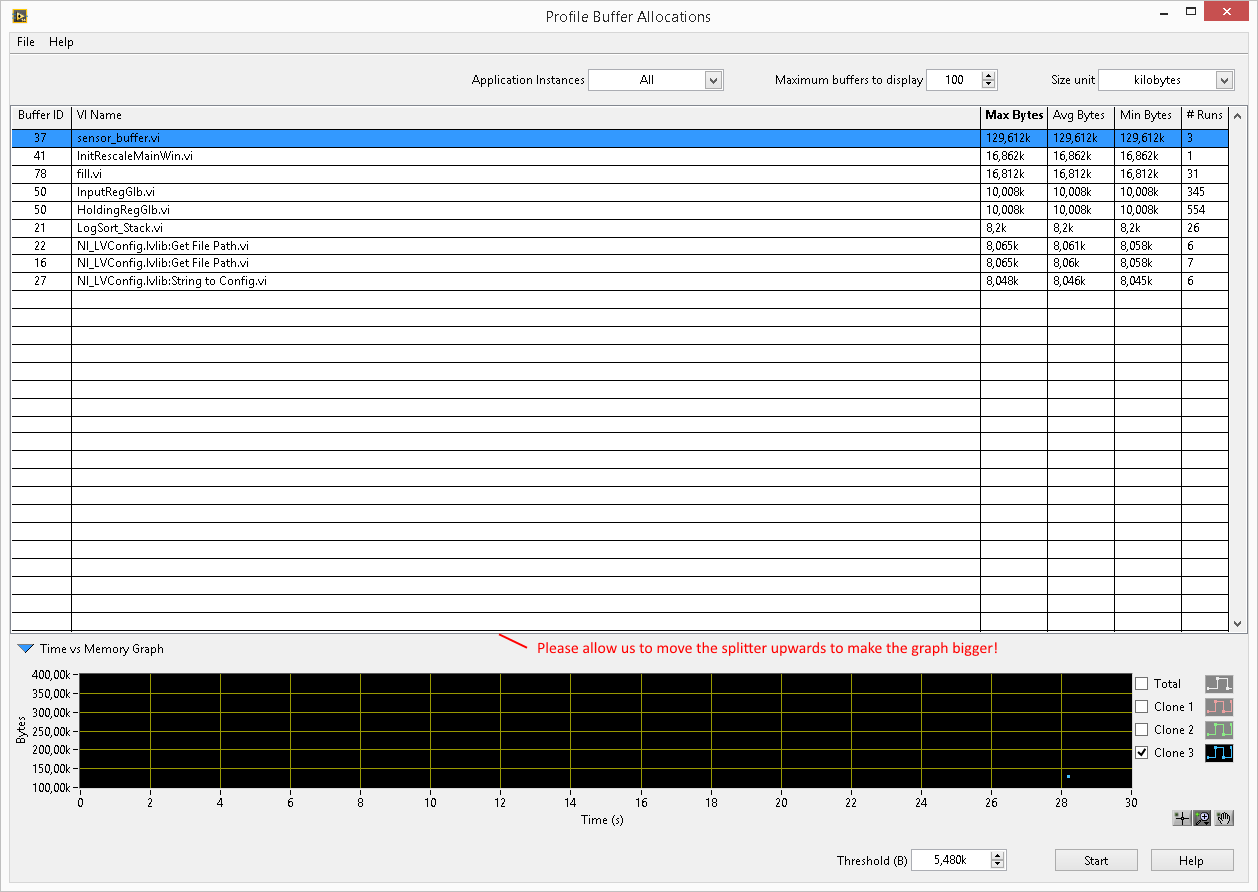
The new Profile buffer allocations function introduced in 2014 Service Pack 1 is a nice addition, but there are a couple of things that surprised me about it;


1. The graph at the bottom is very small (why not show it by default as well, makes it easier to notice for new users), and you cannot rescale it to make it easier to read. This should be simple enough to support (and as many ideas her eon the exchange suggests; such functionality should always be available).

2. The profiler does not update while monitoring. It would be much nicer to be able to actually see the allocations as they happen; to link the events to actions in the program...Instead we have to stop the trace,  and then try to link the graph to past events...


3. Even though you can choose a size unit, the graph will always use bytes...It should use the same size unit as you have chosen for the table view, or have its own unit control.


expand graph in profiler.png

3 Comments
robdye
NI Employee (retired)

Thanks for the suggestions, Mads.


This feature jumped onto the fast track from an experimental, in-house, development tool to shipping product when we found it to be extremely useful for our in-house G development. We felt that holding it back from customers until it was perfect was too cautious.


We have begun to receive feedback from a number of sources (your post here, the beta forums, the CLA summit two weeks ago) and are glad to see so many interested customers. We have decided that the quickest way to get desired changes into customer hands is to let the community of expert G developers modify and improve it. In the next release of LabVIEW (the dates for which can be easily guessed) we will ship the UI portions of the PBA tool without password protection. There are only a few VIs that we wish to keep private, mainly because we want to discourage users from establishing direct dependencies on things we may change.


As for your particular ideas: 1) and 3) seem like very simple changes. (Though I must admit that I don't know the code well enough to say this for certain.)


Your second idea would have problems, because the output file has a "footer" that is written after all the records have been written. Also, during execution, the file is being written from multiple threads under mutual exclusion, and reading the file while this is happening, without using the same mutex, could result in corrupt data being read. I think that this idea would actually be a good one for integration into the Desktop Execution Trace Toolkit, which has a "live feed" model.


Your comments indicate that you find the graph to be one of the more useful aspects of the PBA Tool. I can tell you that the graph was a little bit of an afterthought during the UI brainstorming we had. We did the graph because the information was there in the file and we thought it could be useful, but weren't convinced that it was that important. Perhaps you can explain how you would like to use the information that is provided by the graph.

Mads
Active Participant

I guess I'm so used to thinking graphically  that the graph is where I instictively turn to for information (after all that's why I love LabVIEW).


If the trace happened in real-time we could see the effect of events as they were generated in the software, and check if the memory allocations stop when we expect them to...(If not, *then* I would visit the table for more details). 


If the underlying logging technique does not allow for live updates the testing becomes less interactive, but still very useful. 

Darren
Proven Zealot
Status changed to: Declined

Any idea that has received less than 2 kudos within 2 years after posting will be automatically declined.