- Subscribe to RSS Feed
- Mark Topic as New
- Mark Topic as Read
- Float this Topic for Current User
- Bookmark
- Subscribe
- Mute
- Printer Friendly Page
EMG Signal Linear Regression implementation
10-21-2011 04:01 PM
- Mark as New
- Bookmark
- Subscribe
- Mute
- Subscribe to RSS Feed
- Permalink
- Report to a Moderator
Hello,
i'm trying to implement a linear regression of emg signal....
i'm reading a file that has the emg signal, and I need to implement linear regression on RMS and FFT signal.
I've read some posts, and was suggested to use the Curve Fitting VI....
I'm using lv2010.
As in the literature, by the slope of linear regression could detect fatigue of muscle.....
Could someone help me to get it works?!
Attached the VI and the signal.
- Tags:
- EMG
- linear
- Regression
10-23-2011 10:02 PM
- Mark as New
- Bookmark
- Subscribe
- Mute
- Subscribe to RSS Feed
- Permalink
- Report to a Moderator
Hi Ramon,
I didn't see you VI, but I guess you need to do linear fitting for each muscle contraction instead of fitting for the whole signal which may includes several contractions.
Thanks!
ZJ Gu
10-25-2011 10:48 PM
- Mark as New
- Bookmark
- Subscribe
- Mute
- Subscribe to RSS Feed
- Permalink
- Report to a Moderator
Hi ZJ Gu,
my lvm file is a simple contraction with 30 seconds duration....
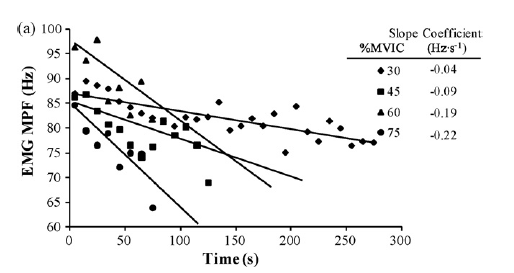
how do authors implement something to get this graph below ?
10-26-2011 12:41 AM
- Mark as New
- Bookmark
- Subscribe
- Mute
- Subscribe to RSS Feed
- Permalink
- Report to a Moderator
Hey,
I think this is linear fitting for MPF not for EMG itsself. The time axis is duration for contraction?
Thanks!
ZJ Gu
10-26-2011 07:20 AM
- Mark as New
- Bookmark
- Subscribe
- Mute
- Subscribe to RSS Feed
- Permalink
- Report to a Moderator
Yeah, ZJ Gu!!
X axis is duration for contraction.... and Y axis is the frequencies values of the contraction....
like in some articles, could Y be mean frequency (MPF), median frequency (MDF), RMS values (in time domain)...
but until now i don't have success....
When I read the EMG file (signal.lvm), how to separate Y and X values?
Should read the whole file, or by small samples?
Thanks!
10-26-2011 08:00 AM
- Mark as New
- Bookmark
- Subscribe
- Mute
- Subscribe to RSS Feed
- Permalink
- Report to a Moderator
Hi,
Usually, you calculate the MDF or MPF by using small moving windows of your signal (like 250 msec) with or without interleave. So with a 30 seconds signal and taking 250 msec windows of it without interleaving you would get 120 values (30000 msec / 250 msec) of MDF or MPF that you could plot on a graph.
HTH,
Michel
10-26-2011 09:41 AM
- Mark as New
- Bookmark
- Subscribe
- Mute
- Subscribe to RSS Feed
- Permalink
- Report to a Moderator
Hi Exovede,
check if I'm right:
I'm using a sampling rate of 2000 Hz. As whole signal has 30 s of duration, there will be 60.000 points .
So, to apply a window of 0,5 s, can I simply configure the Read Meas File to read 1000 points in a while loop until EOF?
That is what i'm already doing....
10-26-2011 09:49 AM
- Mark as New
- Bookmark
- Subscribe
- Mute
- Subscribe to RSS Feed
- Permalink
- Report to a Moderator
Hi Ramon,
Yes, you could do it that way. For each 1000 points, pass a Hanning window on this 1000-points signal then compute the MDF (and/or MPF) then you would have 60 values to plot vs time (each value would correspond to a 0,5 second increment).
Salutations,
Michel
10-26-2011 10:51 AM
- Mark as New
- Bookmark
- Subscribe
- Mute
- Subscribe to RSS Feed
- Permalink
- Report to a Moderator
Hi Exovede,
I will try to make yours suggestion....
Thanks for the tip.
have you take a look in my VI ?
it's missing only the hanning window?
should i use the "curve fitting VI" to generate the "best fit" or use the "linear fitting vi" ?
See ya!
10-26-2011 11:29 AM
- Mark as New
- Bookmark
- Subscribe
- Mute
- Subscribe to RSS Feed
- Permalink
- Report to a Moderator
Hi Ramon,
No, I haven't look your VI...we're still at LV2009.
The fitting for the MDF/MPF vs Time is, usually, a linear fitting and the result is a slope in Hertz/second unit.
Salutations,
Michel
