Turn on suggestions
Auto-suggest helps you quickly narrow down your search results by suggesting possible matches as you type.
Showing results for
Topic Options
- Subscribe to RSS Feed
- Mark Topic as New
- Mark Topic as Read
- Float this Topic for Current User
- Bookmark
- Subscribe
- Mute
- Printer Friendly Page
Displaying the trigger level threshold in a waveform graph
Member
11-12-2007 11:28 AM
Options
- Mark as New
- Bookmark
- Subscribe
- Mute
- Subscribe to RSS Feed
- Permalink
- Report to a Moderator
How can I display the trigger level threshold configured by an trigger vi (don`t remember the name) in a waveform graph? Is that possible actually?
Trusted Enthusiast
11-12-2007 03:20 PM - edited 11-12-2007 03:22 PM
Options
- Mark as New
- Bookmark
- Subscribe
- Mute
- Subscribe to RSS Feed
- Permalink
- Report to a Moderator
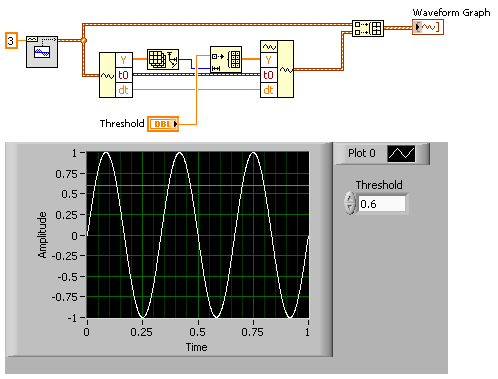
May be you could plot simultaneously an additionnal curve (well... a constant line). Use a build array function to feed the graph with both the signal and the threshold value. As shown in this example ?
C:\Documents and Settings\Administrateur\Local Settings\Temp\Example_BD.png
Message Edité par chilly charly le 11-12-2007 10:22 PM
Chilly Charly (aka CC)
