From Friday, April 19th (11:00 PM CDT) through Saturday, April 20th (2:00 PM CDT), 2024, ni.com will undergo system upgrades that may result in temporary service interruption.

We appreciate your patience as we improve our online experience.

LabVIEW

cancel
Showing results for 
Search instead for 
Did you mean: 

How do I create a horizontal bar plot?

I am trying to create a horizontal bar plot. When I right click on the legend, select bar plots, then try to click one of the horizontal options, they are all grayed out. I have tried programatically change the bar plots property, by entering 1, 2 and 3, but with no luck. (also, what is the significance of 1, 2, or 3? the help file doesn't address this)

I am using Labview 7.

Any help is greatly appreciated.
0 Kudos
Message 1 of 13
(7,859 Views)
To get the horizontal bar plots, you need to use an xy-graph.

(edit: attached an example in LabVIEW 7.0)

Message Edited by altenbach on 05-09-2005 04:27 PM

Message 2 of 13
(7,855 Views)
Thank you. I wish it would have said that in the documentation....
0 Kudos
Message 3 of 13
(7,848 Views)
Hello, I know this is an old thread, but I couldn't find anything more relevant. If anyone can help I would be most appreciative.

Altenbach, your example for horizontal bar graphs is great.

I have a need for something slighlty different, I wish to display several quantities in a horizontal bar graph, each quantity will only have one value. I modified your example to add two more "channels", and it works as I expect. (Attached, in LV8.5)

One thing I do not know how to do though, is what determines how thick the individual bars are (i.e. in the y-axis). In my example they are quite skinny, and I would like them to be much fatter, so that they are almost touching each other. Am I missing something simple here? Changing the line thickness does not seem to have any effect.

Also, is there any way to get the labels (speed 1,2 and 3) to display in the y-axis? I placed them there myself manually and am hoping there is a more elegant solution.

Many thanks
Neil
0 Kudos
Message 4 of 13
(7,677 Views)
Well, I think you are looking in the wrong place and approaching this way too complicated. 😮
 
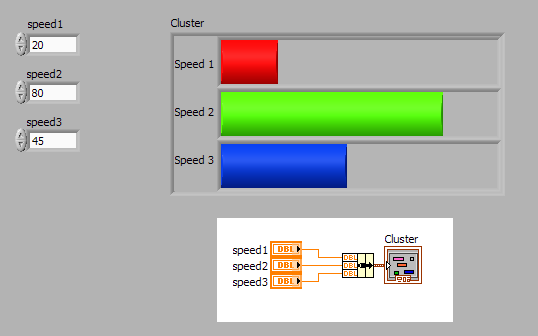
How about a cluster of three vertical progress bars, for example? 😄
 
 
If you want, just show the scale of the bottom indicator and make sure they are all scaled the same (see attached VI, LV 8.0).


Message Edited by altenbach on 03-06-2008 11:20 AM
Download All
Message 5 of 13
(7,670 Views)
Perfect!

Where do I have to go to hand in my LabVIEW badge? The complete irony of the situation is that I am using progress bars in the very same VI that needs to update the barcharts, and it didnt even cross my mind to use them! Thanks for pointing out what should have been obvious Smiley Very Happy
0 Kudos
Message 6 of 13
(7,648 Views)

So glad these forums exist. Spent the last 3 hours thinking exactly the same way as the OP before I found this thread. Thank you Altenbach and my kudos duly given (albeit to a 6 year old post!).

0 Kudos
Message 7 of 13
(6,684 Views)

How can I programatically display number of sliders based on raw data and show pass (green) and Fail (red) on 2 sliders? Please see attach VI.

*************************************************
CLD
*************************************************
0 Kudos
Message 8 of 13
(6,577 Views)

Clusters have a fixed number of elements.


If all bars have the same style, just use an array of bars instead and programmatically resize the container to change the number of visible elements.


The code you have attached makes very little sense. What is the purpose of the shift register, for example?

0 Kudos
Message 9 of 13
(6,567 Views)

@altenbach wrote:

If all bars have the same style, just use an array of bars instead and programmatically resize the container to change the number of visible elements.


Here's what I had in mind.

0 Kudos
Message 10 of 13
(6,562 Views)