From Friday, April 19th (11:00 PM CDT) through Saturday, April 20th (2:00 PM CDT), 2024, ni.com will undergo system upgrades that may result in temporary service interruption.
We appreciate your patience as we improve our online experience.
From Friday, April 19th (11:00 PM CDT) through Saturday, April 20th (2:00 PM CDT), 2024, ni.com will undergo system upgrades that may result in temporary service interruption.
We appreciate your patience as we improve our online experience.
An electrocardiogram (ECG) is commonly used in clinical applications to help doctors diagnose cardiac diseases such as tachycardia. Aside from directly analyzing an ECG, researchers and doctors also extract other indirect measurements from ECG signals. One of the most popular measurements is heart rate variability (HRV). HRV measurements analyze how RR intervals, which show the variation between consecutive heartbeats, change over time.
A normal one-cycle ECG signal is made up of several waves.

The peak with the highest amplitude is called the R wave. An RR interval is the time that elapses between two successive R waves. The lower peaks are the P wave, the T wave, and the U wave, respectively.
The HRV Analyzer is an application for extracting measurements from RR interval signals. This application includes the following features:
Complete the following steps to import an RR interval signal to the HRV Analyzer.
The HRV Analyzer supports preprocessing techniques, such as detrending.
Complete the following steps to detrend the RR interval signal you imported.
The HRV Analyzer supports the following signal analysis methods:
In the Signal Analysis section, select the signal analysis method you want to apply to the RR interval signal. If the method you select requires you to configure settings, click the Settings ... button to display the configuration dialog box of that method.
| Note The Settings ... button is unavailable if the method you select does not have settings to configure. |
Click the Run button to update the signal analysis results continuously. Click the Stop button to stop updating the signal analysis results.
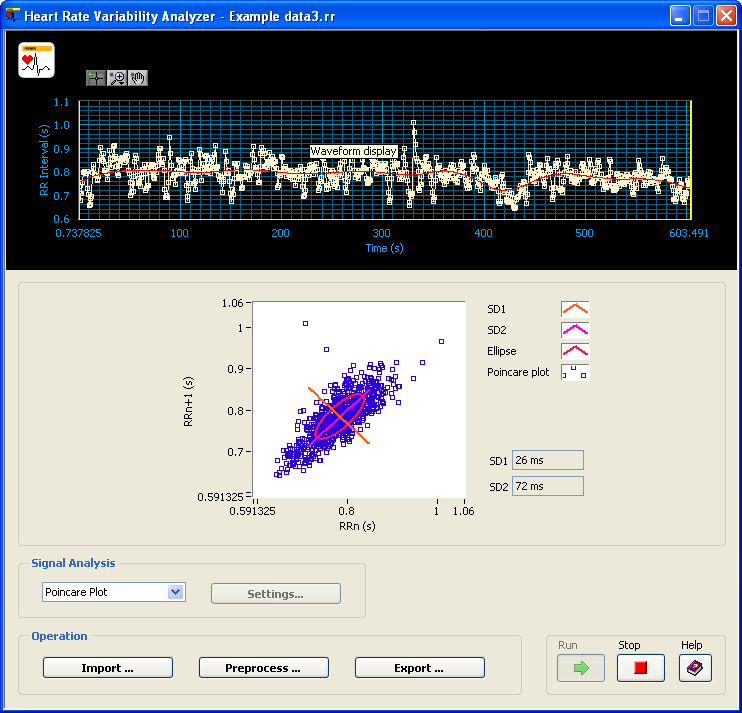
The HRV Analyzer can export important information about the RR interval signal you analyze to a text file. Features such as statistics measures, Poincare plot measures, and frequency domain measures are included in this text file.
Click the Export ... button to export features to a text file.

